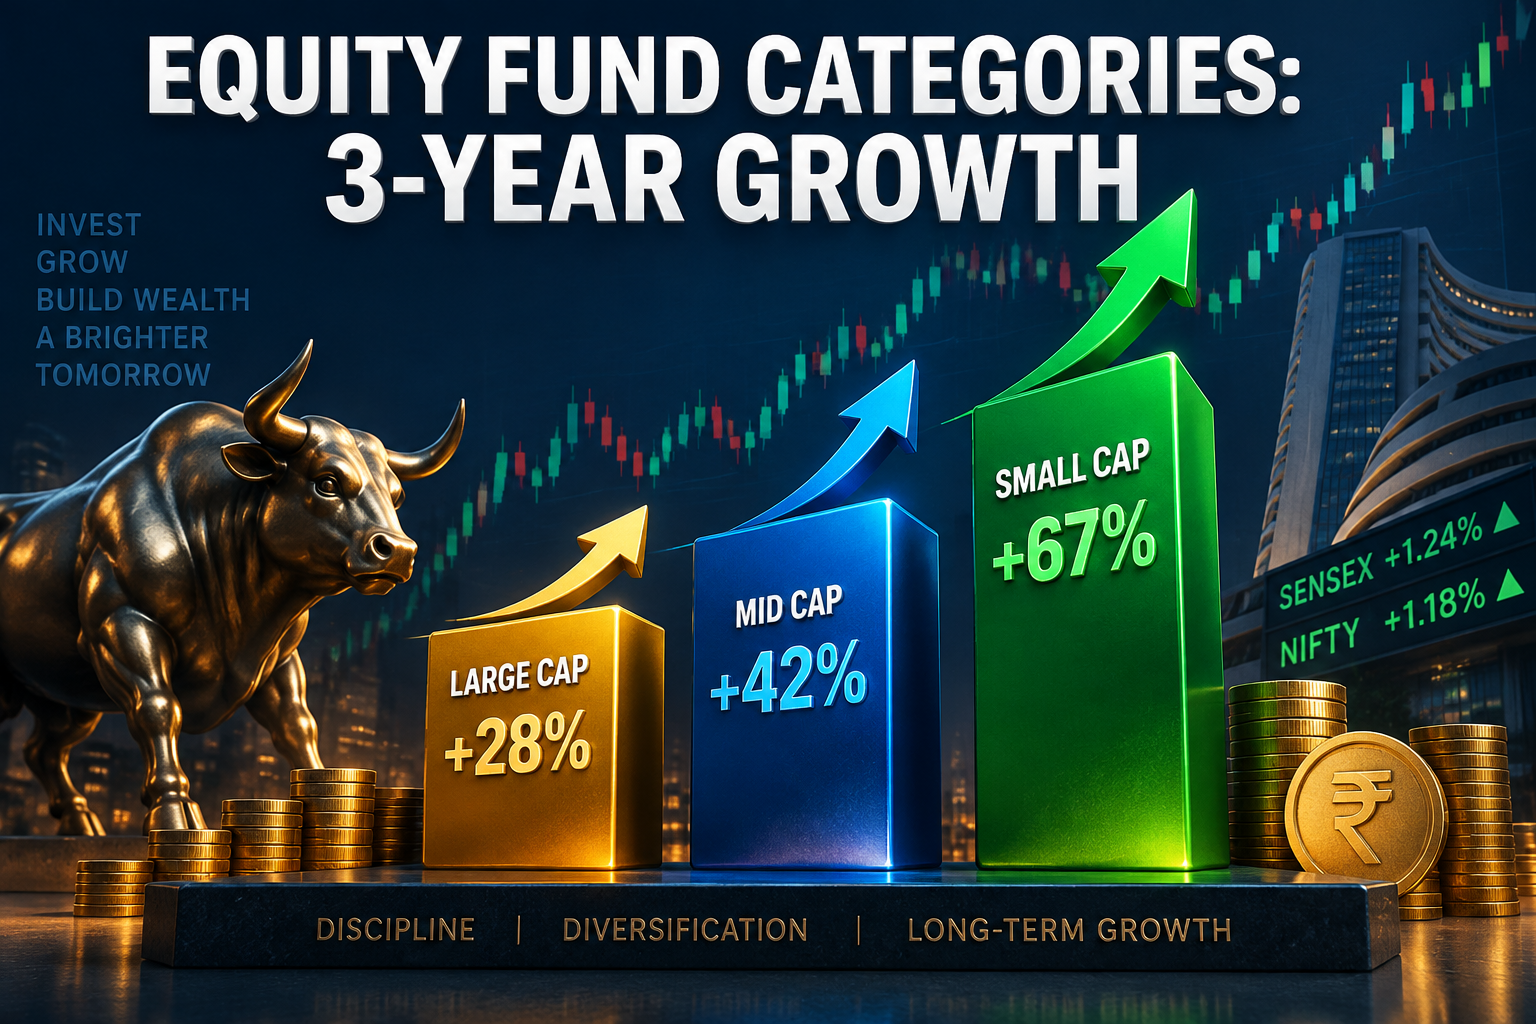
Which equity fund categories showed best overall growth in 3 years?
When it comes to equity fund growth, they can be evaluated in terms of AUM growth or folio growth.
EQUITY FUND FOLIOS GROW AT 3-YEAR CAGR OF 23.0%, AUM AT 29.7%
When it comes to equity fund growth, they can be evaluated in terms of AUM growth or folio growth. While the AUM growth shows the size and clout of the fund category, it is folio growth that actually captures retail intensity. To further fine-tune the process, these funds are indexed on returns, and ranked on combined average.
If you look at the 11 categories of equity funds over last 3 years, folios have grown at a CAGR of 22.96%, while AUM has grown at a CAGR of 29.69%. That is impressive CAGR growth over 3 years. What is more relevant is that the total folios and total AUM have approximately doubled in the last 3 years, despite global geopolitical turmoil.
| Equity Schemes | Folios May-26 | Folios May-23 | CAGR Folios | AUM May-26 | AUM May-23 | CAGR AUM | AVG Rank |
|---|---|---|---|---|---|---|---|
| Multi Cap Fund | 1,16,41,382 | 42,12,703 | 40.33% | 2,32,886.94 | 74,016.91 | 46.53% | 1.00 |
| Sectoral/Thematic Funds | 3,23,92,112 | 1,32,09,299 | 34.85% | 5,35,187.18 | 1,86,684.60 | 42.06% | 2.50 |
| Small Cap Fund | 2,84,49,224 | 1,15,81,947 | 34.93% | 4,04,379.58 | 1,53,806.54 | 38.02% | 2.50 |
| Mid Cap Fund | 2,52,57,209 | 1,08,20,927 | 32.65% | 4,87,793.68 | 2,04,479.88 | 33.62% | 4.50 |
| Large & Mid Cap Fund | 1,39,42,522 | 79,10,456 | 20.79% | 3,39,999.87 | 1,40,558.18 | 34.24% | 5.50 |
| Value / Contra Fund | 90,13,652 | 47,93,275 | 23.43% | 2,10,504.18 | 97,844.37 | 29.09% | 6.00 |
| Flexi Cap Fund | 2,39,64,185 | 1,27,31,864 | 23.47% | 5,63,895.97 | 2,62,586.89 | 29.02% | 6.00 |
| Dividend Yield Fund | 11,96,628 | 7,41,636 | 17.29% | 31,305.62 | 15,209.50 | 27.20% | 8.00 |
| Large Cap Fund | 1,71,79,356 | 1,29,34,624 | 9.92% | 3,97,060.82 | 2,51,231.75 | 16.48% | 9.50 |
| Focused Fund | 55,43,597 | 52,58,096 | 1.78% | 1,74,258.49 | 1,06,413.05 | 17.87% | 10.00 |
| ELSS | 1,63,35,643 | 1,52,82,099 | 2.25% | 2,36,446.07 | 1,63,766.51 | 13.02% | 10.50 |
| Total of Equity Funds | 18,49,15,510 | 9,94,76,926 | 22.96% | 36,13,718.41 | 16,56,598.17 | 29.69% |
Data Source: AMFI (Folios are numbers, AUM is ₹ in Crore)
THREE MACRO TAKEAWAYS FROM THE 3-YEAR EQUITY FUND DATA
- The top category with the brown shade are the equity fund categories with the best combined growth (AUM and folios). The top bracket is dominated by 3 alpha hunting fund categories, and one allocation-linked equity fund category (Multi-Cap Fund).
- The second set of funds shaded in blue are the factor related funds. These may have the potential, but are complex to grasp and equity difficult to administer and implement. Hence, the interest levels remain modest in this category.
- The list of equity funds shaded in green are the out-of-favour fund categories. Large caps are more of a Kurtosis play while ELSS has lost its sheen with the New Tax Regime (NTR). The folio growth, especially, of these funds stays in single-digit.
KEY TAKEAWAYS FROM THE EQUITY FUND GROWTH RANKINGS
- The CAGR growth of equity fund folios at 22.96% saw a range of growth numbers. Multi-cap funds, sector funds and small cap funds saw best CAGR growth in folios. That is where retail interest gravitated. Multi-Cap funds had a low comparable base.
- The pecking order in AUM has been more or less similar; with multi-cap funds, sectoral funds, and small cap funds again leading the AUM charge. The AUM impact on growth over the last 3 years has been a lot more supportive of all categories.
- One of the interesting takeaways is the investor preference for alpha hunting over the last 3 years, even in the midst of very volatile and uncertain markets. This explains the elevated interest in sectoral funds, small cap funds, and mid-cap funds.
- In terms of retail preference (as revealed by folios), multi-cap funds are the preferred bet for allocation. While Flexi-Caps are popular, investors are not too convinced about its long-term utility. Same is the case with Large & Mid-Cap funds.
- If we look at folios in absolute numbers; sector funds, small cap funds, mid-cap funds and Flexi-Cap funds lead the way. Large cap fund have fallen sharply in terms of folio rank over the last 3 years, clearly showing retail interest shifting away.
- In terms of AUM, the large cap funds have fallen from being second in 2023 to fifth in 2026. The top ranked equity funds by AUM in 2026 are Flexi Cap funds, Sectoral Funds, Mid-Cap Funds, and Small Cap funds. Dividend yield funds are lowest on AUM.
The 3-year comparison of AUM and folios of equity funds shows a preference towards alpha hunting. Investors are willing to take a higher risk, as long as it is value accretive.
Want help choosing funds that suit your goals?
Start with Tick FundsDisclaimer: Mutual fund investments are subject to market risks; read all scheme-related documents carefully. SERNET is an AMFI-registered mutual fund distributor and receives commission from fund houses.
Was this article helpful?