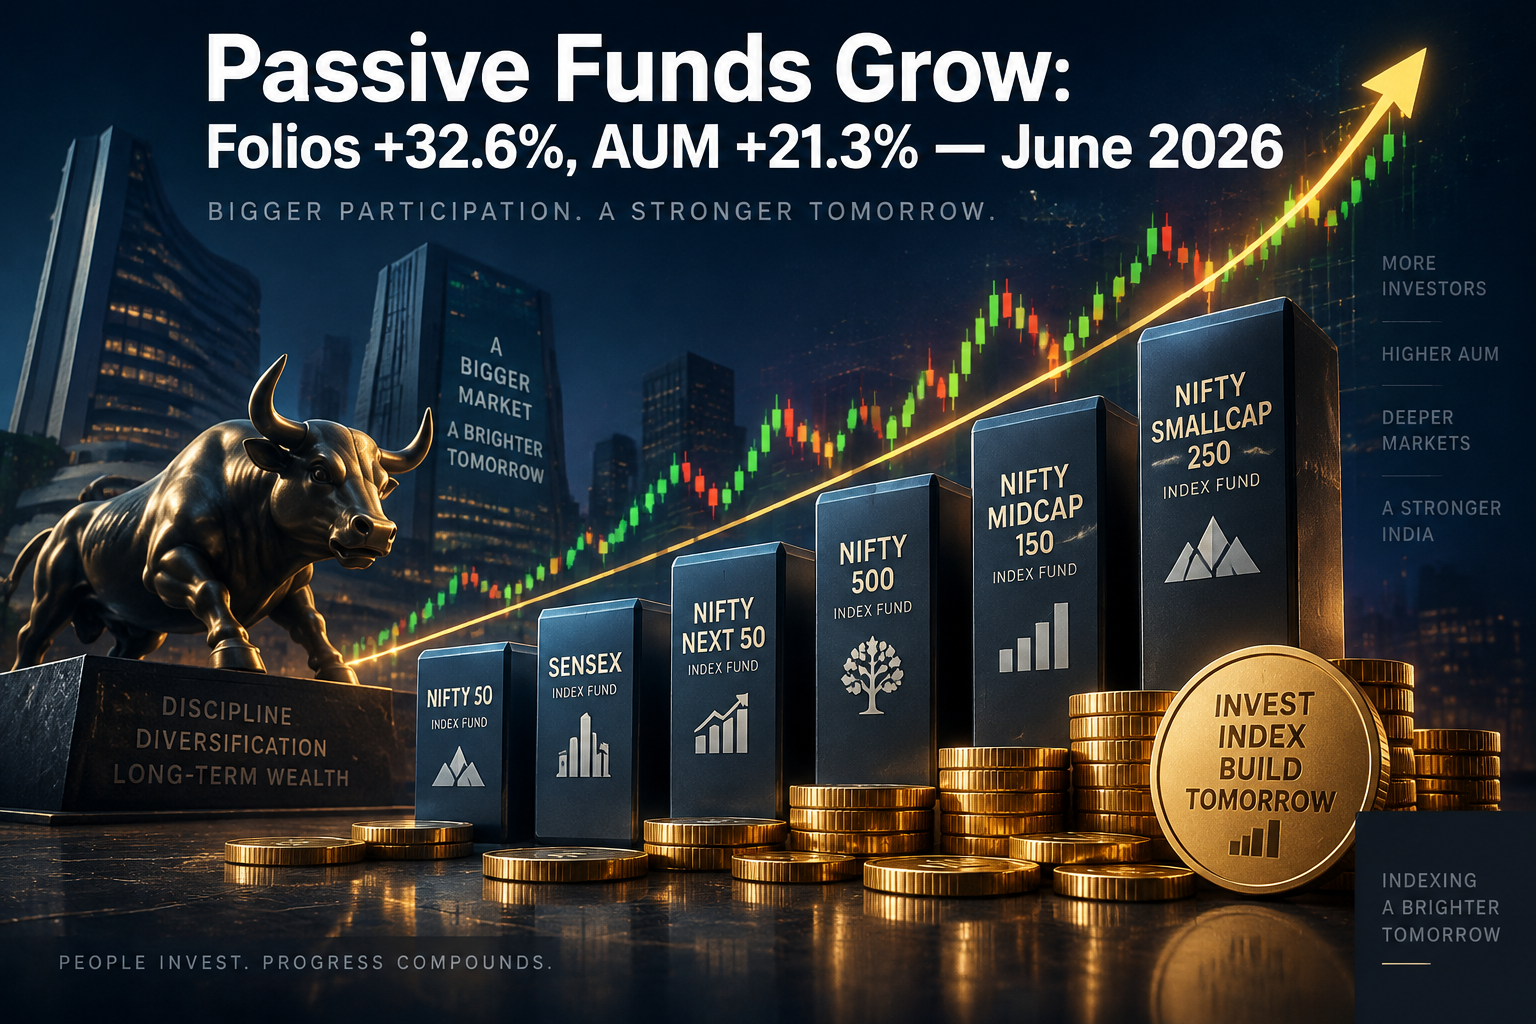
Passive Funds grow Folios by 32.6%, AUM by 21.3% in June 2026
At ₹16,724 crore, passive inflows in June 2026 witnessed a sharp rebound. The growth in passive folios and passive AUM yoy is still impressive, but there is drop in momentum.
PASSIVE FLOWS BOUNCE BACK SHARPLY IN JUNE 2026
At ₹16,724 crore, passive inflows in June 2026 witnessed a sharp rebound. The growth in passive folios and passive AUM yoy is still impressive, but there is drop in momentum. After negative flows in April and flat flows in May; June was more normal. Out of the 12 passive fund categories, the outflow to inflow ratio was 5:7. AUM leaders in the passive space were; equity index ETFs, equity index funds, and gold ETFs in that order. June 2026 saw sharp revival in flows into gold ETFs and silver ETFs after the sharp price correction.
| Passive Fund Schemes | Jun-26 Folios | YOY (%) | Jun-26 AUM | YOY (%) | Net flows |
|---|---|---|---|---|---|
| Equity Index Funds (Domestic) | 1,48,74,987 | 14.66% | 2,31,678.28 | 21.24% | 2,860.28 |
| Equity Index Funds (International) | 2,88,918 | 23.40% | 8,097.87 | 46.73% | -13.54 |
| Debt Index Funds (TMIFs) | 1,73,142 | -4.03% | 87,327.56 | -15.14% | -2,001.85 |
| Debt Index Funds (Ex-TMIF) | 34,976 | 234.57% | 6,040.81 | 5.17% | -742.54 |
| Other Index Funds | 1,17,368 | 17.42% | 3,769.44 | 0.89% | -160.90 |
| Gold ETF | 1,24,75,958 | 63.00% | 1,70,148.42 | 162.67% | 3,443.24 |
| Equity oriented ETFs (Domestic) | 1,89,31,335 | 16.08% | 7,81,044.22 | 7.53% | 8,576.34 |
| Equity oriented ETFs (International) | 12,42,690 | 32.14% | 20,585.39 | 38.43% | 0.00 |
| Debt Oriented ETFs | 16,70,275 | -31.95% | 94,354.04 | -3.46% | 374.94 |
| Silver ETF | 53,92,787 | 492.45% | 78,943.78 | 289.14% | 4,286.47 |
| FOFs on overseas Active Funds | 14,66,718 | 88.04% | 37,906.61 | 87.70% | 155.85 |
| FOFs on overseas Passive Funds | 5,23,912 | -11.96% | 10,593.12 | 24.63% | -54.05 |
| Total of Passive Funds | 5,71,93,066 | 32.57% | 15,30,489.55 | 21.30% | 16,724.26 |
Data Source: AMFI (Net AUM ₹ in Crore), Folios in Numbers, Net flows pertain to June 2026
PASSIVE FLOW STORY FOR JUNE 2026
- Overall passive fund flows at ₹16,724 crore in June 2026 marked a sharp revival in investor interest, led by flows into equity index ETFs, Gold ETFs, and Silver ETFs.
- For June 2026, gold ETFs saw net inflows of ₹3,443 crore while silver ETFs saw net inflows of ₹4,287 crore; as bottom fishing crept in after the sharp correction.
- Equity index ETFs saw very robust inflows of ₹8,576 crore in June, although debt-oriented index funds continued to witness steady outflows over last few months.
- Global diversification continues to attract interest through global FOFs, but the more significant metrics here is the sharp revival in folio accretion in global FOFs.
- While inflows into gold and silver ETFs can be attributed to bottom-fishing, the selling in debt index ETFs was more due to fears of RBI rate hike to counter rising inflation.
TAKEAWAYS FROM THE FOLIO AND AUM STORY IN JUNE 2026
While AUM captures overall impact, folios capture retail intensity of demand. AUM growth tends to be cyclical; while folios are more secular in their pattern.
- Let us look at folio growth yoy for the year to June 2026. Silver ETFs at 492%, non-TMIF debt funds at 235%, FOFs on overseas active funds at 88.1%, and Gold ETFs at 63.0% were the big drivers of folio growth.
- What about the passive fund categories seeing contraction in folios in the month of June 2026? Debt oriented ETFs saw folio contraction of (32.0%), FOFs on Overseas Passive Funds saw folio contraction of (12.0%), and Debt Index TMIFs of (4.0%).
- The surge in folios of gold and silver ETFs can be attributed to the 46-year record returns on gold and silver in 2025. While the momentum has slowed in recent months, June saw a revival of interest in precious metals ETFs.
- What about the AUM growth story on yoy basis? Again, it was silver ETFs at 289% and gold ETFs at 163% that ruled the roost. In addition, the FOFs on overseas active funds also saw folio accretion of a robust 87.7% on yoy basis.
- On an overall basis, the momentum of growth in folios and growth in AUM has been tapering for passive funds. This is partially due to the higher base effect; and partially due to concerns over FPI selling, geopolitical risk, and missing the AI gravy train.
There are 3 trends visible in the passive data for June 2026. Firstly, there are inflation concerns over debt ETFs. Secondly, there is a visible shift back to passive equity as a strategy. Thirdly, gold and silver ETFs are back on the investor radar in June 2026.
Want help choosing funds that suit your goals?
Start with Tick FundsDisclaimer: Mutual fund investments are subject to market risks; read all scheme-related documents carefully. SERNET is an AMFI-registered mutual fund distributor and receives commission from fund houses.
Was this article helpful?