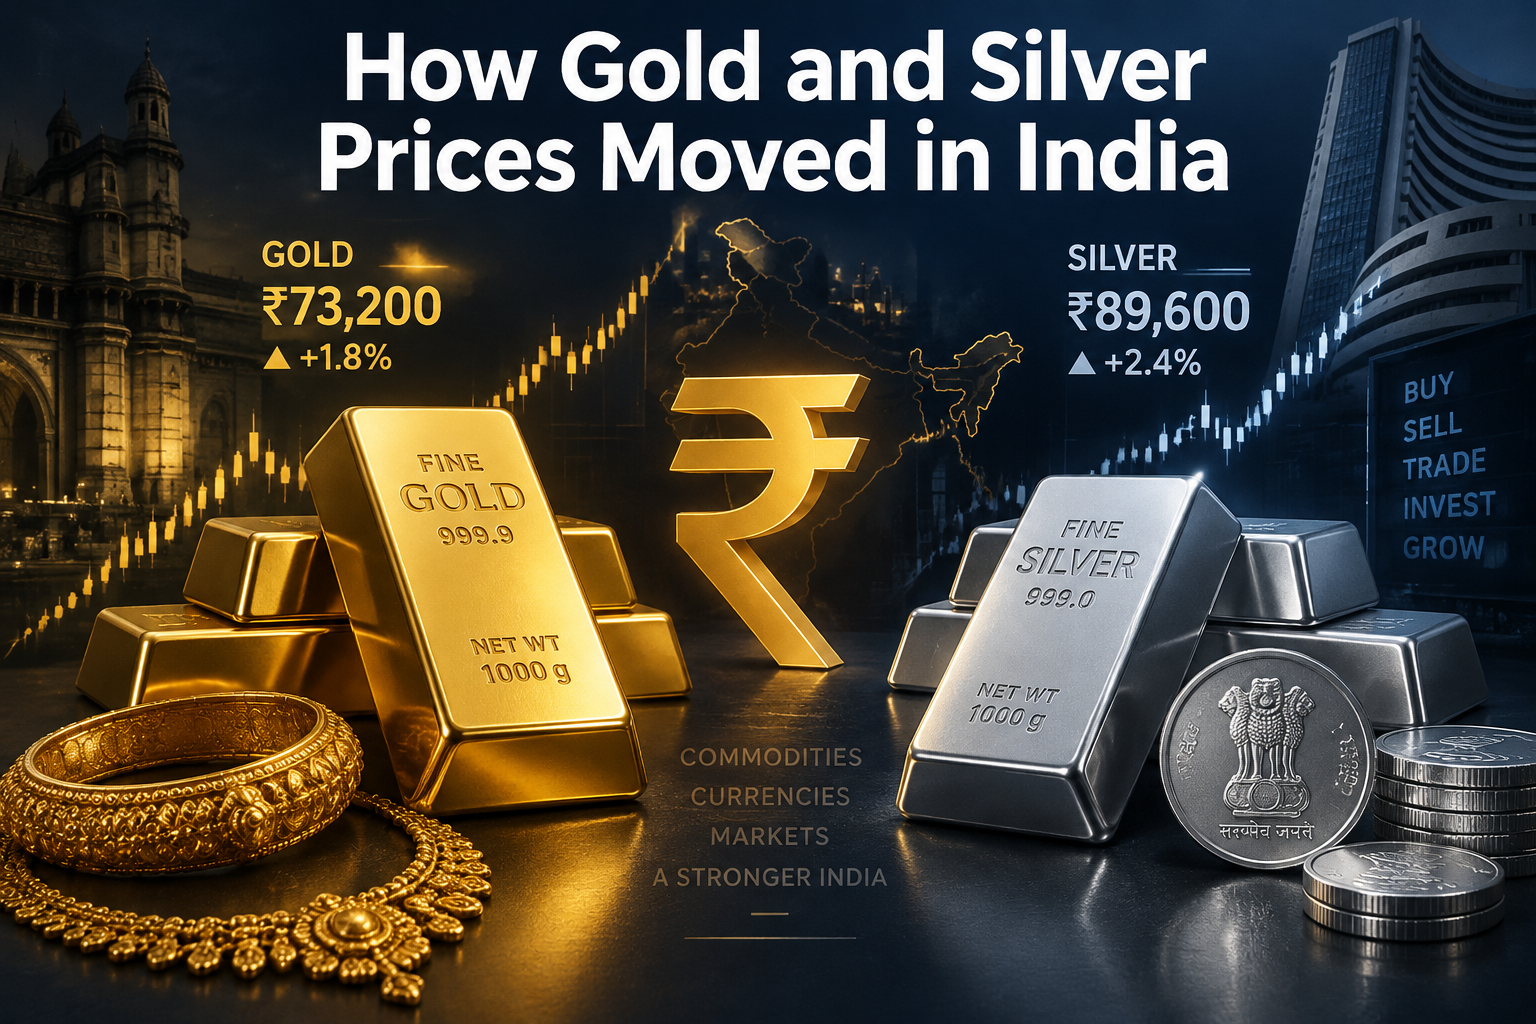
HOW GOLD AND SILVER PRICES MOVED IN INDIA
Here is a quick look at gold and silver prices movement over the last 1 year. In tandem with global LME prices, gold and silver prices in India also peaked in late January and have been trending lower since.
HOW GOLD AND SILVER PRICES MOVED IN INDIA
Here is a quick look at gold and silver prices movement over the last 1 year. In tandem with global LME prices, gold and silver prices in India also peaked in late January and have been trending lower since. The fall in price has been curtailed, compared to the global fall in price, due to the salutary impact of a weak rupee on domestic gold and silver prices.
WHERE ARE THE ABOVE-GROUND GOLD STOCKS?
Historically, total supply of gold stands at over 2,20,000 tonnes valued at around $31 trillion. Here are the details of the break-up of above-ground gold stocks.
| Gold Stock | 2020 | 2021 | 2022 | 2023 | 2024 | 2025 | Share | 10-Y Change |
|---|---|---|---|---|---|---|---|---|
| Jewellery | 95,000 | 96,300 | 97,400 | 98,500 | 99,300 | 99,700 | 45.17% | 10.29% |
| Central banks | 34,100 | 34,600 | 35,700 | 36,700 | 37,800 | 38,600 | 17.49% | 21.38% |
| Private Investment | 44,600 | 45,600 | 46,700 | 47,600 | 48,800 | 51,000 | 23.11% | 36.73% |
| Bars & Coins | 40,800 | 42,000 | 43,200 | 44,400 | 45,600 | 47,000 | 21.30% | 31.65% |
| ETFs | 3,800 | 3,600 | 3,500 | 3,200 | 3,200 | 4,000 | 1.81% | 150.00% |
| Other and OTC | 28,400 | 29,300 | 29,700 | 30,400 | 31,000 | 31,400 | 14.23% | 28.16% |
| Grand Total | 2,02,100 | 2,05,800 | 2,09,500 | 2,13,200 | 2,16,900 | 2,20,700 | 100.00% | 19.95% |
| Data Source: World Gold Council (Absolute figures are in tonnes) |
The sharpest growth over last 10 years happened in gold ETFs, but that is on a fairly small base. What is critical is that; while above-ground gold has grown by 20.0% in the last 10 years, the growth in jewellery holding is just 10.3%. Bulk of alpha in gold holdings came from central bank purchases and private investments. The “Other and OTC” demand largely comprises of industrial applications of gold (predominantly in electronics and medicine). The notional value of all gold futures and options across global markets stands at $1.50 trillion, a fraction of physical gold holdings.
GOLD OUTPERFORMS MOST COMMODITIES OVER DIFFERENT INVESTMENT HORIZONS
Chart Source: World Gold Council
In terms of annualized returns, gold has provided the best returns among commodities over different time horizons. Silver has outperformed gold over a shorter horizon, but with higher risk.
GOLD OFFERS THE BEST DIVERSIFICATION POTENTIAL FOR THE PORTFOLIO
Chart Source: World Gold Council
Adding gold to a global portfolio offers the best diversification benefits among comparable asset classes due to the low correlation that gold enjoys with other portfolio asset classes.
GOLD OUTPERFORMS OTHER COMMODITIES ACROSS INFLATION ENVIRONMENTS
Chart Source: World Gold Council
Gold has clearly beaten inflation over time, something other commodities have struggled to do in a low inflation environment. There is always an inflation premium (alpha) on gold.
WHAT IMPACTED GOLD DEMAND IN THE LAST 3 DECADES?
What has triggered the growing demand for gold in the 21st century? A mix of 6 factors have been instrumental in driving the demand for gold in various forms.
Gold has multiple applications. It is used in jewellery, industrial applications like electronics, by investors as a risk diversifier, and currency by central banks as a safe store of value.
Gold liquidity and monetization has been enabled by factors like easy secondary market, gold loans by banks, growth of ETFs & digital gold, favourable tax treatment of listed gold etc.
The rapid growth in emerging markets like China, India, Turkey, Indonesia has triggered gold demand mainly for jewellery and also for uses in technology. EMs are driving demand alpha.
With the $40 trillion of American debt, global central banks are shifting part of reserves from dollars to gold. Russian sanctions are another reason. That was a major drive post-pandemic.
The ability to securitize gold through gold funds, gold ETFs, digital gold, gold bonds etc via safe and well-regulated market instruments has been another reason for spike in gold demand.
Lastly, gold has always been a natural choice in crisis. The Tech crash, 9/11 Attacks, GFC, Russia-Ukraine war, Iran-US war have all been responsible for spiking the demand for gold.
In the last 26 years since the start of the new millennium, a series of factors have been conducive to a surge in the demand for gold. It is catering to growth, uncertainty, and to a mix of both.
REGIONAL DICHOTOMIES IN GOLD DEMAND AND SUPPLY
What is unique about gold is the vast disparities between demand and supply patterns.
Globally, 70% of the gold demand comes from emerging markets (EM) while 30% comes from Developed markets. Mining Supply is 75% of gold supply and recycling is 25%.
North American accounts for 8% of global gold demand and 13% of global gold mine supply. In case of Latin America, they account for 17% of gold supply but less than 1% of gold demand.
CIS accounts for 16% of gold mining supply, but less than 1% of demand. Europe (ex-Russia) accounts for just 1% of the gold supply, but accounts for 11% of gold demand.
Africa accounts for 28% of mined gold supply but less than 1% of gold demand. Australia brings in 9% of global gold supply, but demand is less than 1%. Dichotomy is highest here.
Asia is the biggest case of surplus demand for gold. The whole of Asia accounts for just 17% of gold supply. However, East Asia consumes 41%, South Asia consumes 31%, and Middle East consumes 8%. In short, Asia supplies 17% of the gold but consumes 80% of global gold.
The biggest surplus suppliers of gold globally are Russia, Latin America, Africa, and Australia. The surplus demand for gold comes from Asia (led by China & India) and Europe.
GOLD SILVER RATIO – DOES IT REALLY WORK?
The gold silver ratio is calculated by dividing the price per oz of gold by the price per oz of silver. For example, the current price of gold stands at $4,648/oz and silver at $68.33/oz. So, the gold silver ratio would be 68.02X.
GOLD SILVER RATIO MAPPED OVER THE LAST 30 YEARS – RATIO OF GOLD TO SILVER PRICES
Chart Source: Goldsilver.com
Historically, the gold silver ratio has been very volatile. However, in the last 100 years, the gold silver ratio has averaged between 50X and 80X. How to interpret the gold silver ratio?
If gold-silver ratio goes meaningfully above 80 (say 95), then it can be interpreted as gold being overpriced or silver being underpriced. Traders can either sell gold or buy silver, although most traders play on gold-silver ratio by doing a long-short; so, it is a play on spread.
If gold-silver ratio goes meaningfully below 50 (say 38), then it can be interpreted as gold being underpriced or silver being overpriced. Traders can buy gold or sell silver.
In reality, the gold silver ratio is quite useful as a broad guide, rather than as a trading indicator.
PERPETUAL SHORTFALL IN SILVER SUPPLY
| Particulars | CY-2021 | CY-2022 | CY-2023 | CY-2024 | CY-2025 |
|---|---|---|---|---|---|
| Silver Supply | 1,023.10 | 1,034.60 | 997.80 | 1,015.10 | 1,030.60 |
| Silver Demand # | 1,102.40 | 1,284.20 | 1,198.50 | 1,164.10 | 1,148.30 |
| Silver ETF Outlay | 64.90 | (117.40 | (37.60) | 61.60 | 70.00 |
| Surplus/(Deficit) | (144.0) | (132.20) | (163.10) | (210.60) | (187.70) |
| Data Source: The Silver Institute (All data in Millions of Ounces) # - Includes Industrial, photography, silverware, jewellery & hedging |
Silver has been in perpetual deficit since 2019 due to a surge in industrial demand from the electrical, electronics, and alternate energy segments. The cumulative impact of these deficits has led to a surge of nearly 200% in the price of silver during the calendar year 2025.
KEY GOLD AND SILVER TRIGGERS TO WATCH OUT IN SEPTEMBER 2026
There are several triggers for gold and silver prices in the first fortnight of September.
The Jackson Hole Symposium in the last week of August will be a key trigger for gold and silver prices. Kevin Warsh, Chief of Federal Reserve, is expected to deliver his address at Jackson Hole. The markets will be closely watching for signals on rate action.
The September meeting of the Fed will be critical for gold prices. The 9:3 vote is a clear indication that support for a rate hike is increasing. A rate hike will increase the opportunity cost of holding precious metals and make owning gold and silver less attractive.
Tensions in the Middle East will continue to be a big trigger for gold prices. The situation threatens to become an all-out military plus economic war. With the Straits of Hormuz and the Bab-al-Mandeb under stress, traders are likely to gravitate towards safe haven assets.
Central bank buying of gold has revived in Q2-2026 at 289 tonnes of net buying. That is nearly 60% higher on a yoy basis. Also, the gold buying is being led by the People’s Bank of China (PBOC) and the central bank of Poland (Narodowy Bank Polski).
With central bank buying and investment demand likely to offset the impact of anti-inflation policies of central banks; gold and silver may be in for a sustained period of buying in September.
Want help choosing funds that suit your goals?
Start with Tick FundsDisclaimer: Mutual fund investments are subject to market risks; read all scheme-related documents carefully. SERNET is an AMFI-registered mutual fund distributor and receives commission from fund houses.
Was this article helpful?