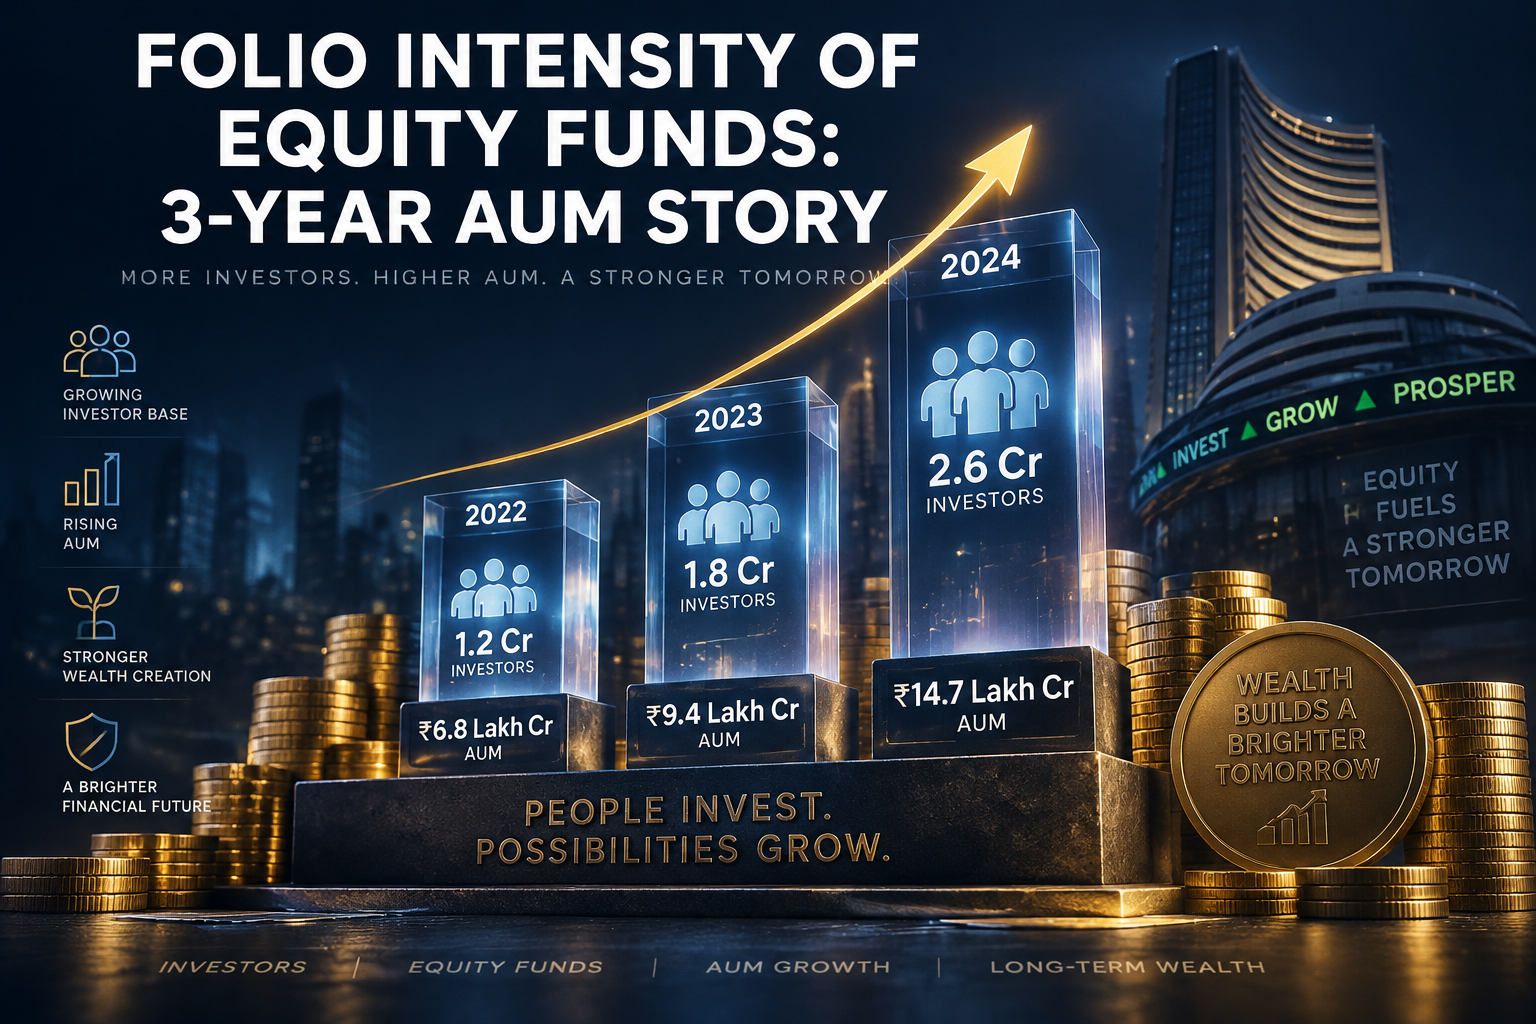
Folio Intensity of Equity Funds – The 3-year AUM story
A quick assessment of growth in popularity and demand of any equity fund category can be done by growth in AUM.
FOLIO INTENSITY OF EQUITY FUNDS TILTS TOWARDS ALPHA
A quick assessment of growth in popularity and demand of any equity fund category can be done by growth in AUM. To avoid the annual cycles, we have looked at the 3-year CAGR of growth in AUM between April 2023 and April 2026. However, that still runs the risk of being overly influenced by price movements; as is the case in India.
One way to overcome the price factor is to include the folio growth over the same period. Folios are a good approximation of retail intensity, although they are not unique to individuals. Growing trend in folios, reflects retail trend quite well. When 3-year CAGR of folios is divided by the AUM CAGR, you get folio intensity; used to rank fund classes.
| Equity Schemes | Folios (Nos.) Apr-26 | Folios (Nos.) Apr-23 | 3-Year CAGR | AUM (₹ cr) Apr-26 | AUM (₹ cr) Apr-23 | 3-Year CAGR | Folio Intensity |
|---|---|---|---|---|---|---|---|
| Mid Cap Fund | 2,50,43,625 | 1,06,95,532 | 32.79% | 4,75,011.50 | 1,92,564.46 | 35.12% | 93.37% |
| Small Cap Fund | 2,82,36,709 | 1,11,25,117 | 36.41% | 3,92,772.18 | 1,42,211.57 | 40.30% | 90.33% |
| Multi Cap Fund | 1,15,78,843 | 41,74,058 | 40.51% | 2,28,691.42 | 70,518.48 | 48.02% | 84.36% |
| Sector/Thematic Funds | 3,23,74,973 | 1,32,28,388 | 34.76% | 5,30,230.25 | 1,78,977.88 | 43.62% | 79.69% |
| Value / Contra Fund | 89,92,093 | 47,14,942 | 24.01% | 2,11,480.45 | 94,049.63 | 31.01% | 77.43% |
| Flexi Cap Fund | 2,37,44,759 | 1,27,15,541 | 23.14% | 5,59,366.31 | 2,52,500.26 | 30.36% | 76.23% |
| Dividend Yield Fund | 12,00,886 | 7,30,675 | 18.01% | 31,518.97 | 14,471.62 | 29.62% | 60.80% |
| Large & Mid Cap Fund | 1,38,49,552 | 78,44,968 | 20.86% | 3,35,218.09 | 1,33,689.15 | 35.86% | 58.18% |
| Large Cap Fund | 1,72,00,691 | 1,29,55,752 | 9.91% | 3,98,834.73 | 2,44,610.92 | 17.70% | 55.98% |
| ELSS | 1,63,83,770 | 1,52,79,990 | 2.35% | 2,37,714.82 | 1,57,972.09 | 14.59% | 16.12% |
| Focused Fund | 55,31,698 | 52,96,509 | 1.46% | 1,73,513.40 | 1,02,984.98 | 18.99% | 7.68% |
| Grand Total | 18,41,37,599 | 9,87,61,472 | 23.08% | 35,74,352.13 | 15,84,551.04 | 31.15% | 74.09% |
Data Source: AMFI
HOW TO READ THE FOLIO INTENSITY TABLE ABOVE?
- Let us first look at the macro picture. Equity fund overall have displayed folio intensity of 74.09%, which shows three-quarter of AUM growth explained by folios.
- The top green-shaded fund classes have the highest folio intensity of more than 90% and these are the higher-risk alpha generating funds in mid-cap and small cap stocks.
- The second blue-shaded category are the funds that are seeing cycles of interest. The first cycle was thematic funds followed by allocation funds across capitalization.
- The third orange shaded fund classes are the strugglers. Clearly, large cap funds have seen a real struggle as they have not been able to distinguish from index funds.
- The last category in red-shade are the laggards. Here, AUM accretion has been tepid, but the folio accretion has been disappointing, hinting at funds out of favour.
FIVE THEMES EMERGING FROM THE FOLIO INTENSITY TABLE
Equity funds overall saw folio intensity of about 74.1% over the last 3 years, which is indicative of robust interest in equity funds. However, there are several sub-stories.
- The big retail draw continues to be mid-cap and small cap funds, which appears to be an extension of their proclivity for smaller stocks. That is evident in folio intensity.
- In absolute terms, multi-cap funds and sectoral funds score higher on AUM growth and folio growth showing that they are the emerging stars in terms of retail demand.
- The shift to multi-cap and flexi-cap funds shows an interesting diversification trend among equity fund investors; looking to spread their capitalization risk in equities.
- Large cap funds have seen waning interest, which can be largely attributed to the Kurtosis effect where large cap funds miss out on concentrated outperformance.
- ELSS has been a clear laggard due to its large cap focus and also after the new tax regime (NTR) offered the benefit of lower taxes without Section 80C outlays.
- Finally, there were categories like dividend yield funds and focused funds, where the challenge appears to be the absence of a clear positioning in the minds of investors.
Based on last 3 years data, alpha generators have shown the highest retail folio intensity, while multi-caps and flexi-caps appear to be emerging items of interest for investors.
Want help choosing funds that suit your goals?
Start with Tick FundsDisclaimer: Mutual fund investments are subject to market risks; read all scheme-related documents carefully. SERNET is an AMFI-registered mutual fund distributor and receives commission from fund houses.
Was this article helpful?