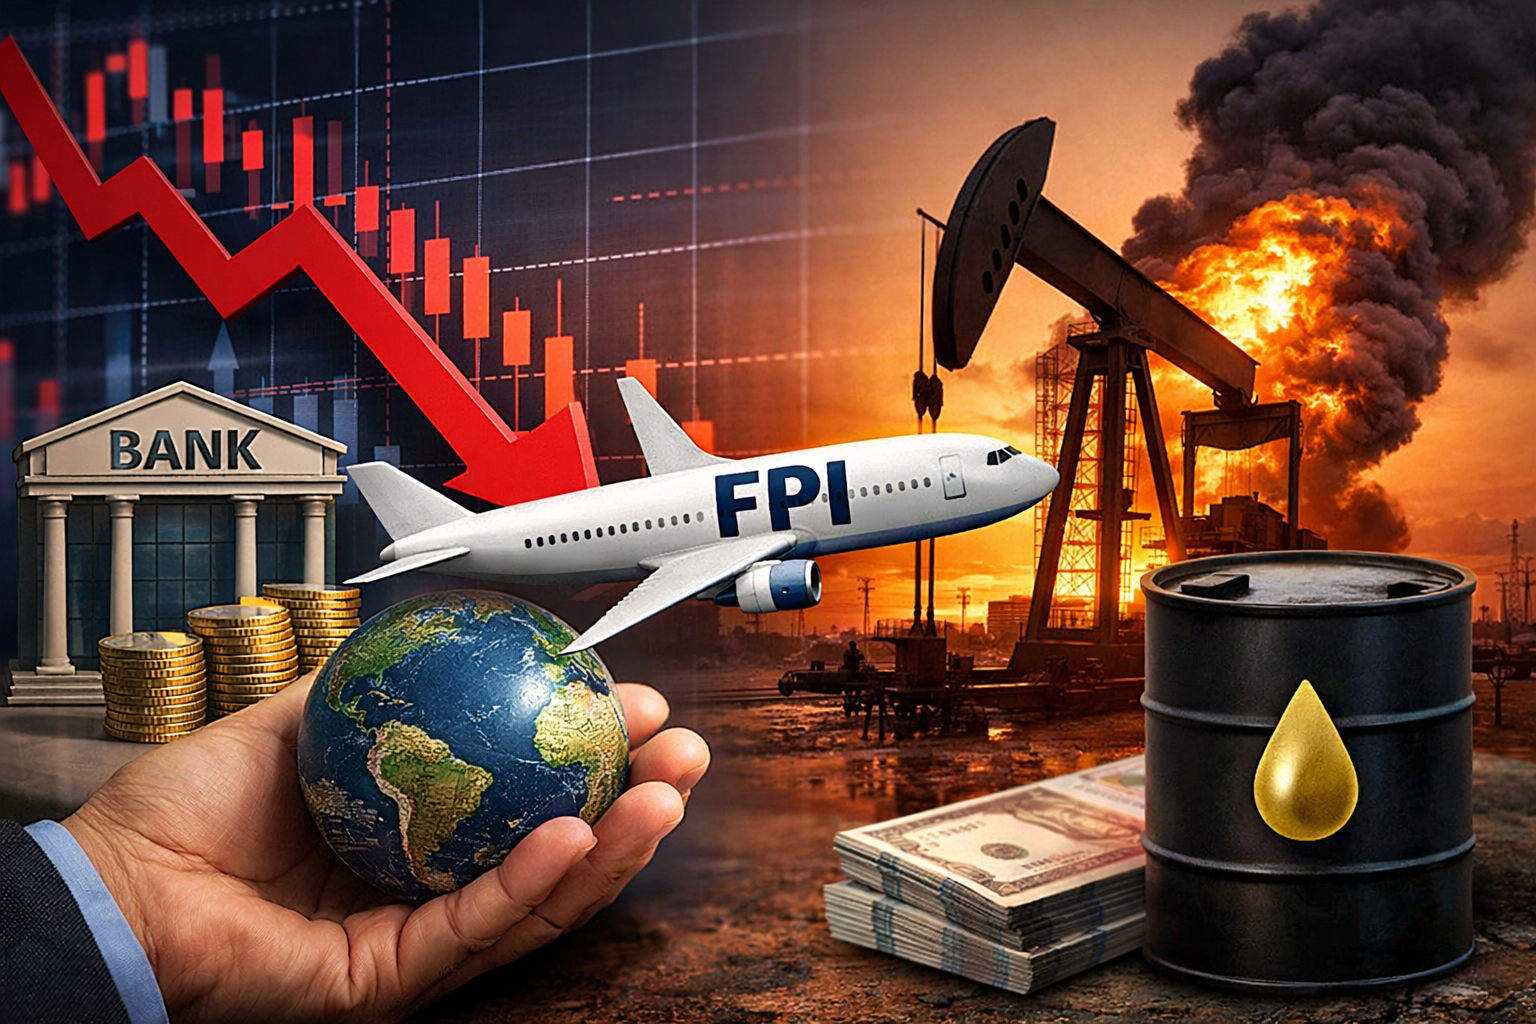
FPI Selling Hits BFSI Amid Oil Shock & MSCI Shift
FPIs sold $5.7B in March 2026, led by BFSI. Rising oil, weak rupee, and MSCI EM weight cuts drove sectoral outflows across Indian equities.
FPI SECTORAL SELLING WEIGHED HEAVILY AGAINST FINANCIALS
The month of March 2026 was supposed to begin on a sour note for FPIs. After all, the US-Israel-Iran war had started on the last working day of February. Ironically, this comes after a month when FPIs were net buyers in Indian equities in the aftermath of the Indo-US trade deal. March-H1 saw FPIs selling equities to the tune of $5.70 billion, with 60% of the selling accounted for by the BFSI stocks. The selling was heavy across banks and also NBFCs as FPIs turned cautious on the macro vulnerabilities of India to rising crude oil prices. BFSI being the largest and most liquid component; bore the brunt of selling.
| Sectoral Classification (NSDL Template) | Equity Flows ($ Million) | Sectoral Classification (NSDL Template) | Equity Flows ($ Million) |
|---|---|---|---|
| Capital Goods | 422 | Services | -138 |
| Metals & Mining | 95 | Construction Materials | -161 |
| Power | 65 | Consumer Durables | -187 |
| Others | 59 | Realty | -231 |
| Consumer Services | 57 | Fast Moving Consumer Goods | -260 |
| Chemicals | 24 | Healthcare | -264 |
| Diversified Industries | 0 | Oil, Gas & Consumable Fuels | -317 |
| Forest Materials | 0 | Construction | -322 |
| Utilities | -2 | Telecommunication | -417 |
| Media, Entertainment | -6 | Automobile and Components | -520 |
| Textiles | -19 | Financial Services (BFSI) | -3,443 |
| Information Technology (IT) | -137 | Grand Total | -5,702 |
| Data Source: NSDL |
FPI SELLING TRIGGERS: SITUATIONAL AND STRUCTURAL
- The war impact on oil and rupee were the immediate concerns for the FPIs as they sold heavily in the Indian markets during the recent week.
- However, the heavy selling in the heavyweight BFSI sector also shows that the FPIs have been aligning portfolios with the fall in the MSCI EM weight for India.
- India’s weight in the MSCI EM index has fallen from 21% in Sep-24 to under 14% in Feb-26. India now ranks behind China, Taiwan, and Korea in the EM weightage.
- While stiff India valuations and Chinese stimuli were key factors; a big shift was to semiconductor stocks in Taiwan and Korea, where India really lost FPI flows.
SECTORAL FPI FLOWS IN MARCH 2026 (FIRST FORTNIGHT)
- Apart from the $5.70 billion in selling, the FPI AUC in equities is down to $710 billion, and overall AUC to $788 billion. Both are multi-year lows in terms of FPI AUC.
- On the positive side, the rare exception was capital goods. FPIs expect India to play a key role in rebuilding of the Middle East, when the war finally ends.
- The other sectors that saw buying; Metals was more a play on global supply shortages, while power was more on domestic demand growing rapidly.
- On the sell-side, the big story was BFSI. Not only do FPIs see BFSI as most vulnerable, but the 60% BFSI selling shows FPIs cutting overweight to MSCI EM index.
- Automobiles and oil are likely to be a double whammy. There are concerns over supply chain bottlenecks, and the risk of how higher oil prices will impact the sector.
- Some sectors like telecom are seeing winding down of aggressive longs, especially stocks like Bharti Airtel. This is also true of oil stocks, in a sense.
- FPIs are expecting consumption to get hit by lower purchasing power. That is evident in the sell-off in FMCG, realty, and in consumer durables. This is secondary impact.
Clearly, FPIs are not happy with this combination of weak rupee and high oil prices; in the midst of plateauing nominal GDP growth. That is evident in their aggressive selling!
Want help choosing funds that suit your goals?
Start with Tick FundsDisclaimer: Mutual fund investments are subject to market risks; read all scheme-related documents carefully. SERNET is an AMFI-registered mutual fund distributor and receives commission from fund houses.
Was this article helpful?