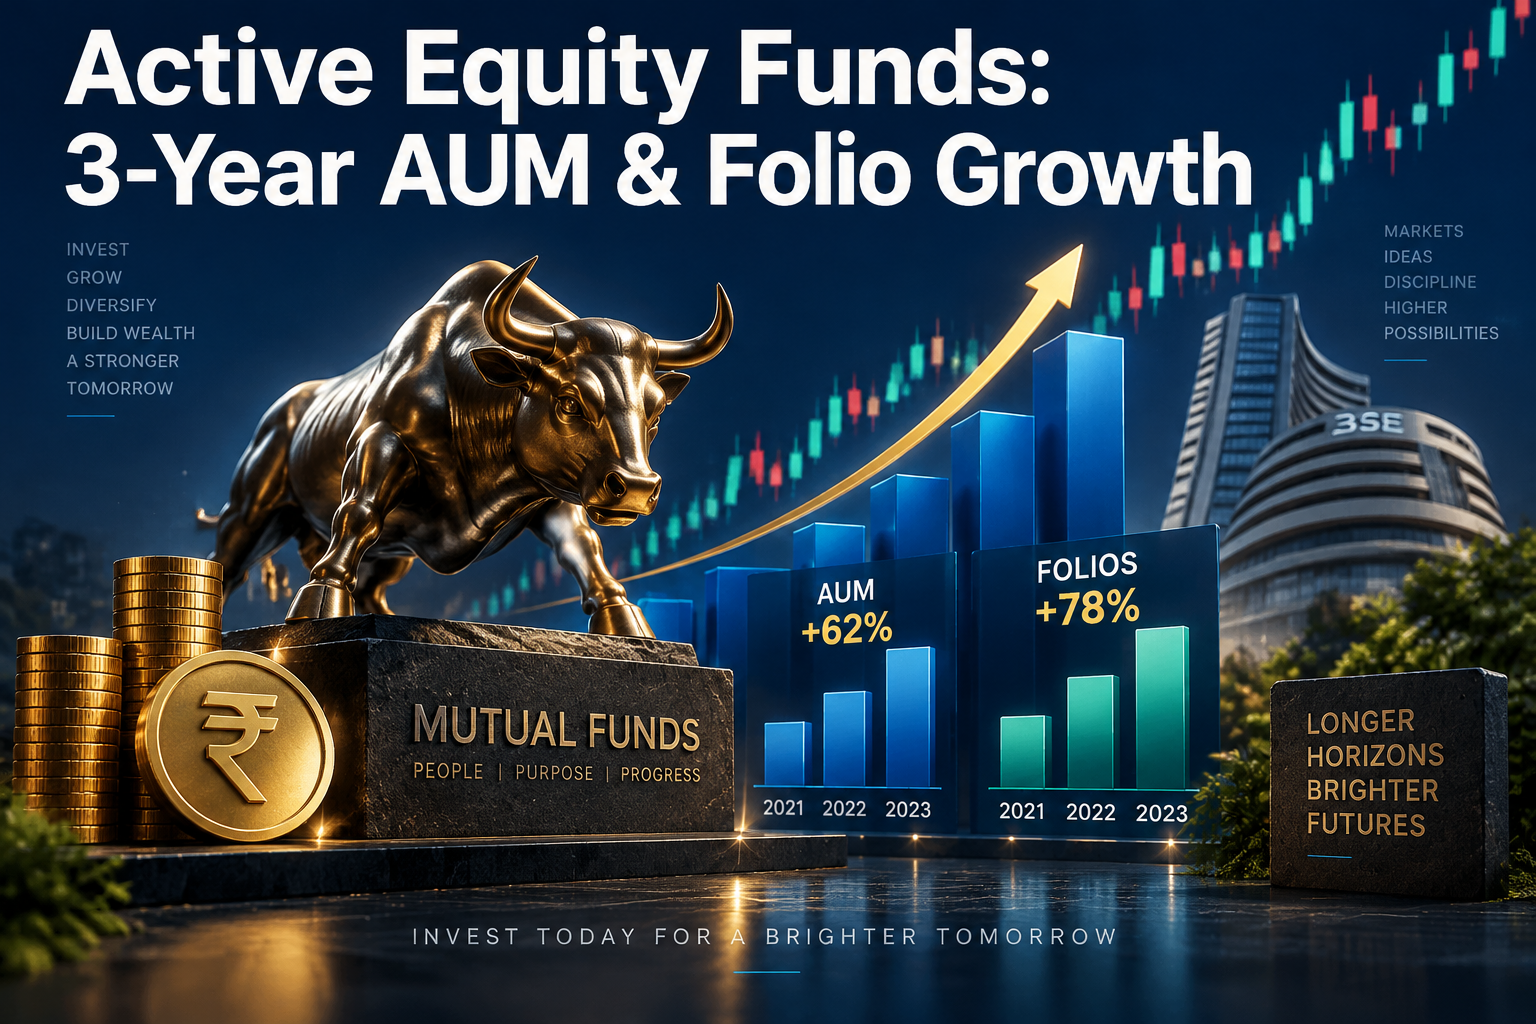
Active Equity Fund growth by AUM and Folios over last 3 years
Mutual fund growth over a period of time can be seen in two different ways. We can evaluate it based on growth in rupee AUM over 3 years. That captures the heft of the fund, but does not capture the retail spread.
A LONGER-TERM PERSPECTIVE OF EQUITY FUND GROWTH
Mutual fund growth over a period of time can be seen in two different ways. We can evaluate it based on growth in rupee AUM over 3 years. That captures the heft of the fund, but does not capture the retail spread. The other way is to capture the growth in folios (accounts) over the 3-year period. Folios are a much better measure of retail appetite and the retail intensity of any particular class of equity fund.
One way to get a composite picture of mutual fund growth is to look at AUM growth and folio growth and take a combined view. This factors in the heft part of the story and also the retail intensity of the story. We have used a 3-year period as it is a fair measure of how growth has sustained over a medium to longer-term. Also, we have used the CAGR growth in AUM and folios to smoothen out the growth trend.
| Equity Fund Category | Sep 2026 AUM (₹ Cr) | Sep 2023 AUM (₹ Cr) | 3-Year CAGR (%) | Sep 2026 Folios (₹ Cr) | Sep 2023 Folios (₹ Cr) | 3-Year CAGR (%) | Rank Score |
|---|---|---|---|---|---|---|---|
| Multi-Cap Fund | 2,48,188 | 93,757 | 38.33% | 1,20,74,365 | 48,31,118 | 35.71% | 1.00 |
| Sector / Thematic | 5,46,857 | 2,20,142 | 35.43% | 3,31,88,556 | 1,43,15,827 | 32.35% | 2.00 |
| Small Cap Fund | 4,61,752 | 1,98,483 | 32.50% | 3,03,81,196 | 1,46,84,798 | 27.42% | 3.50 |
| Mid-Cap Fund | 5,14,213 | 2,45,496 | 27.95% | 2,67,68,077 | 1,19,56,147 | 30.82% | 4.00 |
| Large & Mid-Cap Fund | 3,54,113 | 1,63,176 | 29.47% | 1,45,31,964 | 82,99,513 | 20.53% | 5.00 |
| Flexi-Cap Fund | 5,88,390 | 2,90,270 | 26.56% | 2,50,35,055 | 1,31,61,385 | 23.90% | 5.50 |
| Value & Contra Fund | 2,09,181 | 1,17,251 | 21.28% | 91,16,444 | 53,08,373 | 19.75% | 7.00 |
| Dividend Yield Fund | 30,636 | 18,581 | 18.14% | 11,82,650 | 7,85,733 | 14.60% | 8.00 |
| Large Cap Fund | 3,90,384 | 2,67,582 | 13.42% | 1,69,60,523 | 1,30,47,923 | 9.14% | 9.50 |
| Focused Fund | 1,79,900 | 1,13,548 | 16.58% | 56,45,306 | 51,59,456 | 3.05% | 9.50 |
| ELSS Tax Saver | 2,30,662 | 1,79,803 | 8.66% | 1,61,06,808 | 1,54,23,310 | 1.46% | 11.00 |
| Active Equity Funds | 37,54,276 | 19,08,089 | 25.31% | 19,09,90,944 | 10,69,73,583 | 21.31% | N.A. |
Data Source: AMFI
RANKING ACTIVE EQUITY FUNDS ON A COMBINED SCORE
- Active equity funds were ranked on a combination of AUM growth and folio growth. While AUM growth captured the heft of active equity fund categories, the folio growth captured the retail intensity of the growth. We used 3-year compounded annual growth rate (CAGR) to factor in the compounding effect.
- In the first step, the AUM of various categories of active equity funds for September 2026 were compared with September 2023. For each of these categories, the CAGR over 3 years was calculated. For all active equity funds as a whole, the AUM grew at a CAGR of 25.31% between September 2023 and September 2026.
- In the second step, the Folio Count of various categories of active equity funds for September 2026 were compared with September 2023. For each of these categories, the CAGR over 3 years was calculated. For all active equity funds as a whole, Folios grew at a CAGR of 21.31% between September 2023 and September 2026.
- The various active equity funds were ranked first on AUM 3-year CAGR and then on Folio Count 3-year CAGR. To get a combined view, the average of the two ranks was considered and all the active equity funds were ranked on the combined rank. The ranking shows the best funds on robust growth in AUM and Folios combined.
WHAT WE READ FROM 3-YEAR CAGR GROWTH OF ACTIVE EQUITY FUNDS
- In terms of the CAGR growth of AUM, the best fund categories were Multi-Cap Funds, Sector/Thematic Funds, and Small Cap Funds. In terms of the CAGR of folio count over the last 3 years, the best categories were Multi-Cap Funds, Sector/Thematic Funds, and Mid-Cap Funds. The growth trends are almost similar.
- On combined ranks, let us first look at the top 4 category (shaded in light green). It looks like the combination of heft and retail intensity was dominated by alpha hunting funds with 3 out of 4 being alpha funds. The only exception is multi-cap funds, which is more of an allocation story across capitalization. Despite the recent slowdown, Sector/Thematic funds had a lot of early momentum in their favour.
- The next 4 funds with modest CAGR growth across AUM and folios include 2 allocation funds and 2 strategy funds. In the latter case, the low interest levels have been more an issue of positioning. In the case of flexi-cap funds, the growth has been low due to a high base and the risks of giving full leeway to fund managers.
- The bottom-3 (shaded in light purple) are the cases where there have been fundamental reasons for the low level of AUM and folio growth. In the case of large cap funds, the concerns are more with respect to the kurtosis effect and index funds offering a better alternative. ELSS funds have lost their mojo since India shifted to the new tax regime (NTR). For Focused funds, it is once again, a positioning challenge.
- If one were to sum up the themes emerging from the above analysis of 3-year CAGR growth in AUM and folios; it is about alpha hunting and allocation. Alpha hunting categories like sector funds, small cap funds, and mid-cap funds have dominated the top slot. Allocation fund are popular and spread across the top and the middle segment. These have clearly been the themes driving equity fund flows.
The positive takeaway! Despite flat indices in last 2 years and FPIs selling persistently; the interest in active equity funds has not waned. Whether you look at the CAGR of AUM or the CAGR of folios; the overall growth has been impressive on both counts. The growth has been substantially driven by SIP flows. Investors are definitely taking a long-term approach towards alpha hunting and risk allocation!
Want help choosing funds that suit your goals?
Start with Tick FundsDisclaimer: Mutual fund investments are subject to market risks; read all scheme-related documents carefully. SERNET is an AMFI-registered mutual fund distributor and receives commission from fund houses.
Was this article helpful?