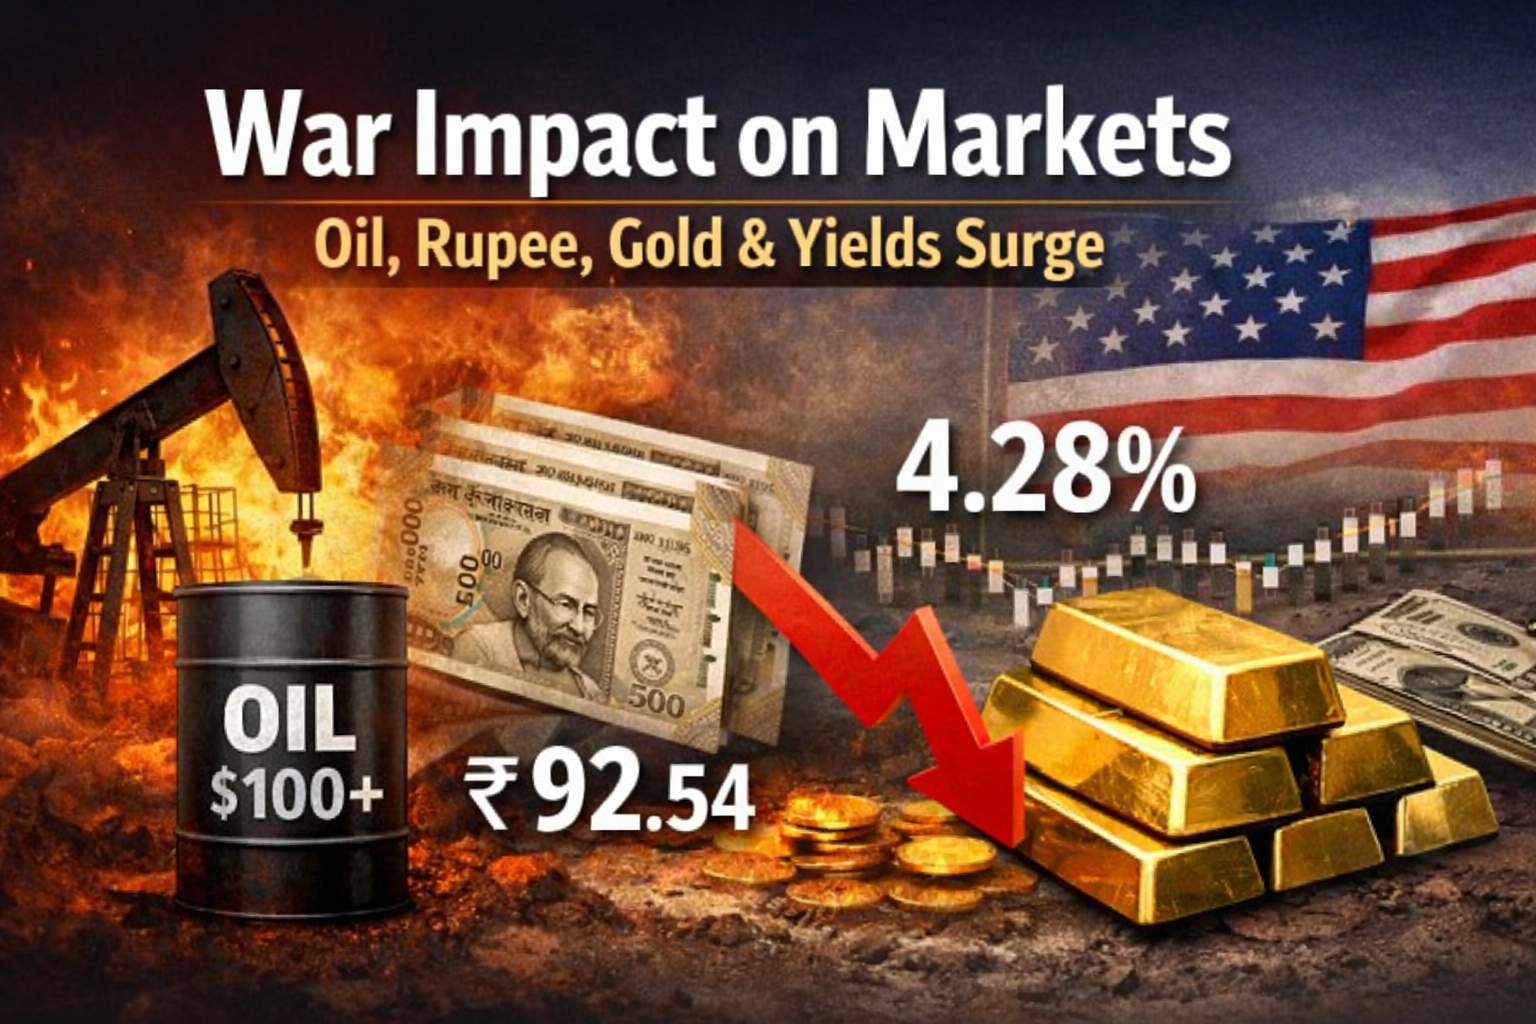
War Impact on Markets: Oil, Rupee, Gold & Yields Surge
Middle East war drives oil above $100, weakens rupee, lifts US yields & dollar. Gold fails to rally. Key global macro trends explained.
WAR FEARS DRIVE GLOBAL MACROS
As the war in the Middle East and West Asia continues to rage, that has become the central focus for global macros. That is hardly surprising. The Straits of Hormuz, which is currently blocked by Iran, accounts for nearly 30% of the global oil trade. Blocking the channel virtually stops the flow of oil to Asia. This has not only led to a spike in the price of oil to above $100/bbl, but has also weakened the Indian rupee sharply.
One would have ideally expected gold and silver to see a lot of buying amidst the uncertainty, but the immediate focus appears to be how to get over the crisis. Hence, investors are even averse to committing funds to gold and silver, despite being considered safe-haven assets. A lot will now depend on how long the wage rages, because this war is not about the losses, but the uncertainty around the length of the war.
US BOND YIELDS SPIKE UP DURING THE WEEK
| Date | Price (%) | Open (%) | High (%) | Low (%) |
|---|---|---|---|---|
| 13-Mar-26 | 4.285 | 4.261 | 4.290 | 4.234 |
| 12-Mar-26 | 4.273 | 4.247 | 4.277 | 4.210 |
| 11-Mar-26 | 4.206 | 4.160 | 4.234 | 4.138 |
| 10-Mar-26 | 4.136 | 4.109 | 4.160 | 4.086 |
| 09-Mar-26 | 4.134 | 4.193 | 4.216 | 4.094 |
| 06-Mar-26 | 4.132 | 4.136 | 4.187 | 4.105 |
Data Source: Bloomberg
Key takeaways on US bond yields data:
- The week saw US bond yields rise from 4.132% to 4.285%
- This can be attributed to likely status quo on the 18-Mar Fed meeting
- While GDP growth was lower, inflation risks are still high for the US
For the week; US 10-year bond yields scaled a high of 4.290% and a low of 4.086%.
US DOLLAR INDEX (DXY) CROSSES 100 AFTER NEARLY 4 MONTHS
| Date | Price (%) | Open (%) | High (%) | Low (%) |
|---|---|---|---|---|
| 13-Mar-26 | 100.36 | 99.69 | 100.54 | 99.59 |
| 12-Mar-26 | 99.74 | 99.45 | 99.76 | 99.25 |
| 11-Mar-26 | 99.23 | 98.94 | 99.30 | 98.70 |
| 10-Mar-26 | 98.83 | 98.80 | 98.95 | 98.49 |
| 09-Mar-26 | 99.18 | 98.86 | 99.69 | 98.70 |
| 06-Mar-26 | 98.99 | 99.01 | 99.43 | 98.84 |
Data Source: Bloomberg
Key takeaways on US Dollar Index data:
- DXY closed above 100-level for the first time since November 24, 2025
- Dollar index bounce was on the back of weakening yen and 2.2% growth in 2025
- However, the debt pile at $40 trillion and the war will be headwinds for the dollar
For the week, US dollar index (DXY) touched a high of 100.54 and a low of 98.49.
INDIA BOND YIELDS FLAT FOR THE WEEK
| Date | Price (%) | Open (%) | High (%) | Low (%) |
|---|---|---|---|---|
| 13-Mar-26 | 6.679 | 6.668 | 6.698 | 6.668 |
| 12-Mar-26 | 6.669 | 6.633 | 6.680 | 6.633 |
| 11-Mar-26 | 6.634 | 6.671 | 6.693 | 6.634 |
| 10-Mar-26 | 6.671 | 6.722 | 6.722 | 6.665 |
| 09-Mar-26 | 6.723 | 6.688 | 6.761 | 6.688 |
| 06-Mar-26 | 6.688 | 6.650 | 6.711 | 6.644 |
Key takeaways on India Bond Yields data:
- India Bond yields were flat with downward bias, closing at 6.679%
- With inflation risks high, markets do not see the RBI MPC cutting rates
- If inflation spikes, we could see a sharp upside impact on bond yields
For the week, India Bond Yields touched a high of 6.761% and a low of 6.633%.
RUPEE (USDINR) WEAKENS AMID OIL PRESSURES
| Date | Price (₹/$) | Open (₹/$) | High (₹/$) | Low (₹/$) |
|---|---|---|---|---|
| 13-Mar-26 | 92.540 | 92.366 | 92.572 | 92.240 |
| 12-Mar-26 | 92.388 | 92.243 | 92.506 | 92.055 |
| 11-Mar-26 | 92.229 | 91.899 | 92.258 | 91.837 |
| 10-Mar-26 | 91.974 | 91.851 | 92.204 | 91.674 |
| 09-Mar-26 | 92.155 | 92.330 | 92.386 | 92.113 |
| 06-Mar-26 | 91.933 | 91.662 | 92.012 | 91.570 |
Data Source: RBI
Key takeaways on USDINR data:
- The Indian rupee weakened from ₹91.933/$ to ₹92.540/$ for the week
- The turmoil in the Middle East and spike in oil prices have hit the rupee
- Heavy FPI selling of $6.55 billion in March has created a rush for hedging.
For the week, the USDINR touched a high of ₹91.674/$ and low of ₹92.572/$.
CRUDE OIL – PRECARIOUSLY POISED ABOVE $100/BBL
| Date | Price ($/bbl) | Open ($/bbl) | High ($/bbl) | Low ($/bbl) |
|---|---|---|---|---|
| 13-Mar-26 | 103.14 | 101.68 | 103.95 | 97.60 |
| 12-Mar-26 | 100.46 | 96.84 | 101.85 | 95.20 |
| 11-Mar-26 | 91.98 | 90.40 | 93.80 | 86.24 |
| 10-Mar-26 | 87.80 | 92.49 | 95.04 | 81.16 |
| 09-Mar-26 | 98.96 | 99.75 | 119.50 | 83.66 |
| 06-Mar-26 | 92.69 | 83.54 | 94.64 | 83.16 |
Data Source: Bloomberg
Key takeaways on Brent Crude Prices:
- Brent Crude closed the week higher; from $92.69/bbl to $103.14/bbl
- Now, crude oil has rallied nearly 60% since the Middle East war started
- The longer the war continues, markets are not ruling out $150/bbl
For the volatile week, Brent Crude touched a high of $119.50/bbl and a low of $81.16/bbl.
SPOT GOLD FACES PRESSURE, DESPITE GLOBAL TURMOIL
| Date | Price ($/oz) | Open ($/oz) | High ($/oz) | Low ($/oz) |
|---|---|---|---|---|
| 13-Mar-26 | 5,019.25 | 5,080.70 | 5,129.13 | 5,009.51 |
| 12-Mar-26 | 5,080.07 | 5,177.38 | 5,194.79 | 5,054.67 |
| 11-Mar-26 | 5,177.07 | 5,189.84 | 5,223.62 | 5,149.95 |
| 10-Mar-26 | 5,192.94 | 5,139.30 | 5,238.70 | 5,117.84 |
| 09-Mar-26 | 5,139.56 | 5,180.45 | 5,199.37 | 5,014.73 |
| 06-Mar-26 | 5,171.12 | 5,077.43 | 5,175.06 | 5,062.89 |
Data Source: Bloomberg
Key takeaways on spot gold (XAU) price data:
- Spot gold tapered in the week from $5,171.12/oz to $5,019.25/oz
- Most investors appear to be fully invested in gold, with little headroom
- Interestingly, the safe-haven demand for gold is missing in this turmoil
For the week, spot gold touched a high of $5,238.70/oz and low of $5,014.73/oz.
SPOT SILVER REMAINS IN A TIGHT RANGE FOR THE WEEK
| Date | Price ($/oz) | Open ($/oz) | High ($/oz) | Low ($/oz) |
|---|---|---|---|---|
| 13-Mar-26 | 80.5764 | 83.6595 | 85.4950 | 79.4291 |
| 12-Mar-26 | 83.8015 | 85.5466 | 87.4950 | 83.0085 |
| 11-Mar-26 | 85.8100 | 88.3035 | 89.4650 | 84.4264 |
| 10-Mar-26 | 88.4225 | 86.7813 | 90.0260 | 86.5028 |
| 09-Mar-26 | 87.0325 | 84.4365 | 87.0825 | 79.6120 |
| 06-Mar-26 | 84.3717 | 82.4258 | 85.0128 | 81.6673 |
Data Source: Bloomberg
Key takeaways on spot silver (XAG) prices:
- The week saw silver tapering and closing near the low point of the day
- India spot silver robust at ₹2,61,200 per KG, amid weak rupee
- Gold silver ratio is down from 104:1 to 62:1; a sort of new normal for the ratio
For the week, spot silver touched a high of $90.03/oz and low of $79.43/oz.
Turn market insight into a plan for your money.
Talk to usDisclaimer: This content is for general information and education only and is not a recommendation to buy or sell any security.
Was this article helpful?