 Announcement: Lorem ipsum dolor sit amet, consectetur adipiscing elit. Donec et quam blandit odio sodales pharetra.
Record SIP Flows Hide a Worry: Stoppage Ratio Touches 82.7% in December 2024
December 2024 saw all-time-high SIP inflows at ₹26,459 crore, yet the SIP stoppage ratio spiked to 82.7%. Here’s why investors are pausing, and what it means for mutual fund flows.
Written by: SERNET Research Team
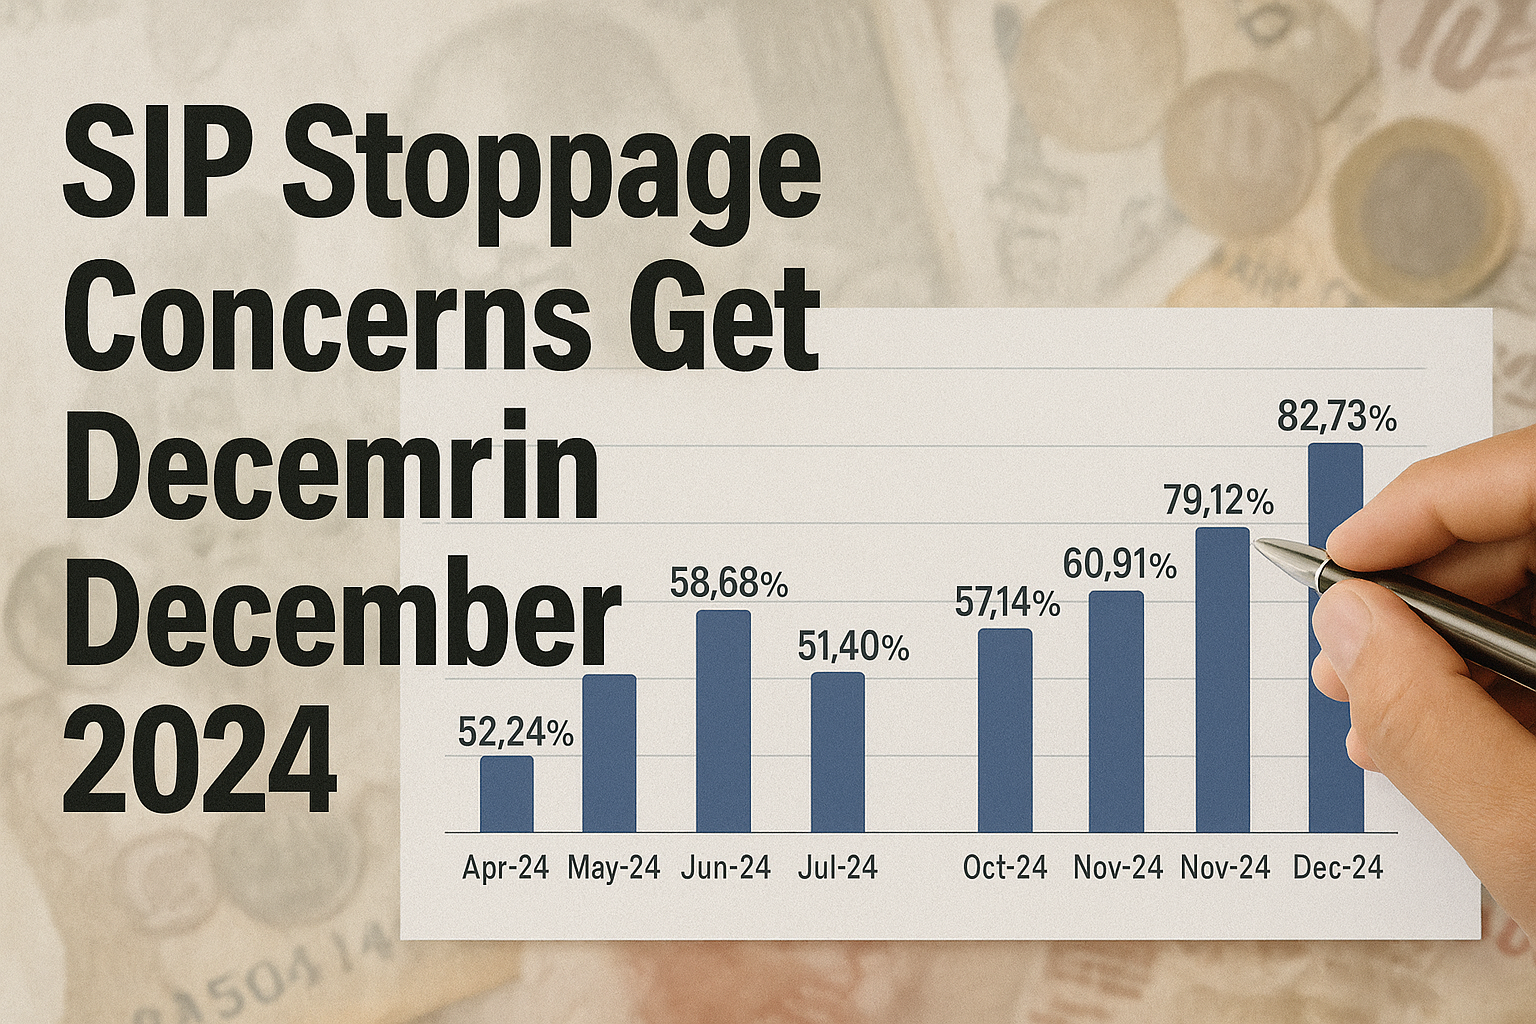
Table of Content
SIP stoppage concerns get deeper in December 2024
The SIP inflows in December 2024 again touched an all-time record level of ₹26,459 crore. This is not just the highest level of monthly SIP, but also a substantial growth over the previous month. The growth in SIP flows is commendable, but there is a catch. AMFI reports gross SIP flows and not net SIP flows, which is why the apparently massive SIP flows do not seem to translate into net flows into equity funds. That gap is, perhaps, best captured by the SIP Stoppage Ratio (SIPSR). The SIPSR is the ratio of SIP accounts closed / redeemed / not renewed to the number of fresh SIPs opened. It shows whether there is accretion to the SIP pool or whether the stoppages are negating any positive impact that fresh flows are having. Based on data, the latter seems to be the case.
| Apr-24 | May-24 | Jun-24 | Jul-24 | Aug-24 | Sep-24 |
| 52.24% | 88.38% | 58.68% | 51.40% | 57.14% | 60.72% |
| Oct-24 | Nov-24 | Dec-24 | FY25 # | ||
| 60.91% | 79.12% | 82.73% | 64.31% | ||
| FY 2019-20 | FY 2020-21 | FY 2021-22 | FY 2022-23 | FY 2023-24 | FY 2024-25 # |
| 57.84% | 60.88% | 41.74% | 56.94% | 52.41% | 64.31% |
Data Source: AMFI (# – 9 months data)
The above table captures the monthly SIP stoppage ratio (SIPSR) and the annualized SIPSR. What are the quick observations? The financial year FY25 has seen a persistent rise in SIPSR month-after-month. Between July and December, the SIPSR has increased from 51.4% to 82.7%. It can be attributed to concerns over market volatility or plain boredom. People continue SIPs only if they are convinced that markets have further upsides. Otherwise, they prefer to let it fade out and rather take a fresh view later!
But the real concern is in the second part of the table, which captures the annualized SIPSR. Even a cursory glance tells you how the SIPSR has surged over last year. What is a bigger matter of concern is that the SIP Stoppage Ratio at 64.31% in FY25 (9-months data) is higher than the SIPSR during the two pandemic years. It only indicates that the sense of uncertainty in markets is more than it was during the pandemic period.
We Need To Also Look At The Other Side of The Story
Firstly, it is intriguing why AMFI does not report net SIP flows, instead of gross SIP flows. AMFI’s argument is that some SIPs convert into lumpsum; but that is not a strong case, as it should work both ways. Today, there is a lot of focus on gross SIP flows, while it matters little. In the last 6 months, outstanding SIP folios grew at just 10.4% overall. SIP AUM in the same period grew by just 4%; which means net SIP flows are hardly making much of a difference to overall AUM accretion. SIP AUM is still market rally dependent!
Comments