Announcement: Lorem ipsum dolor sit amet, consectetur adipiscing elit. Donec et quam blandit odio sodales pharetra.
Has Mutual Fund Folio Growth Really Slowed Down?
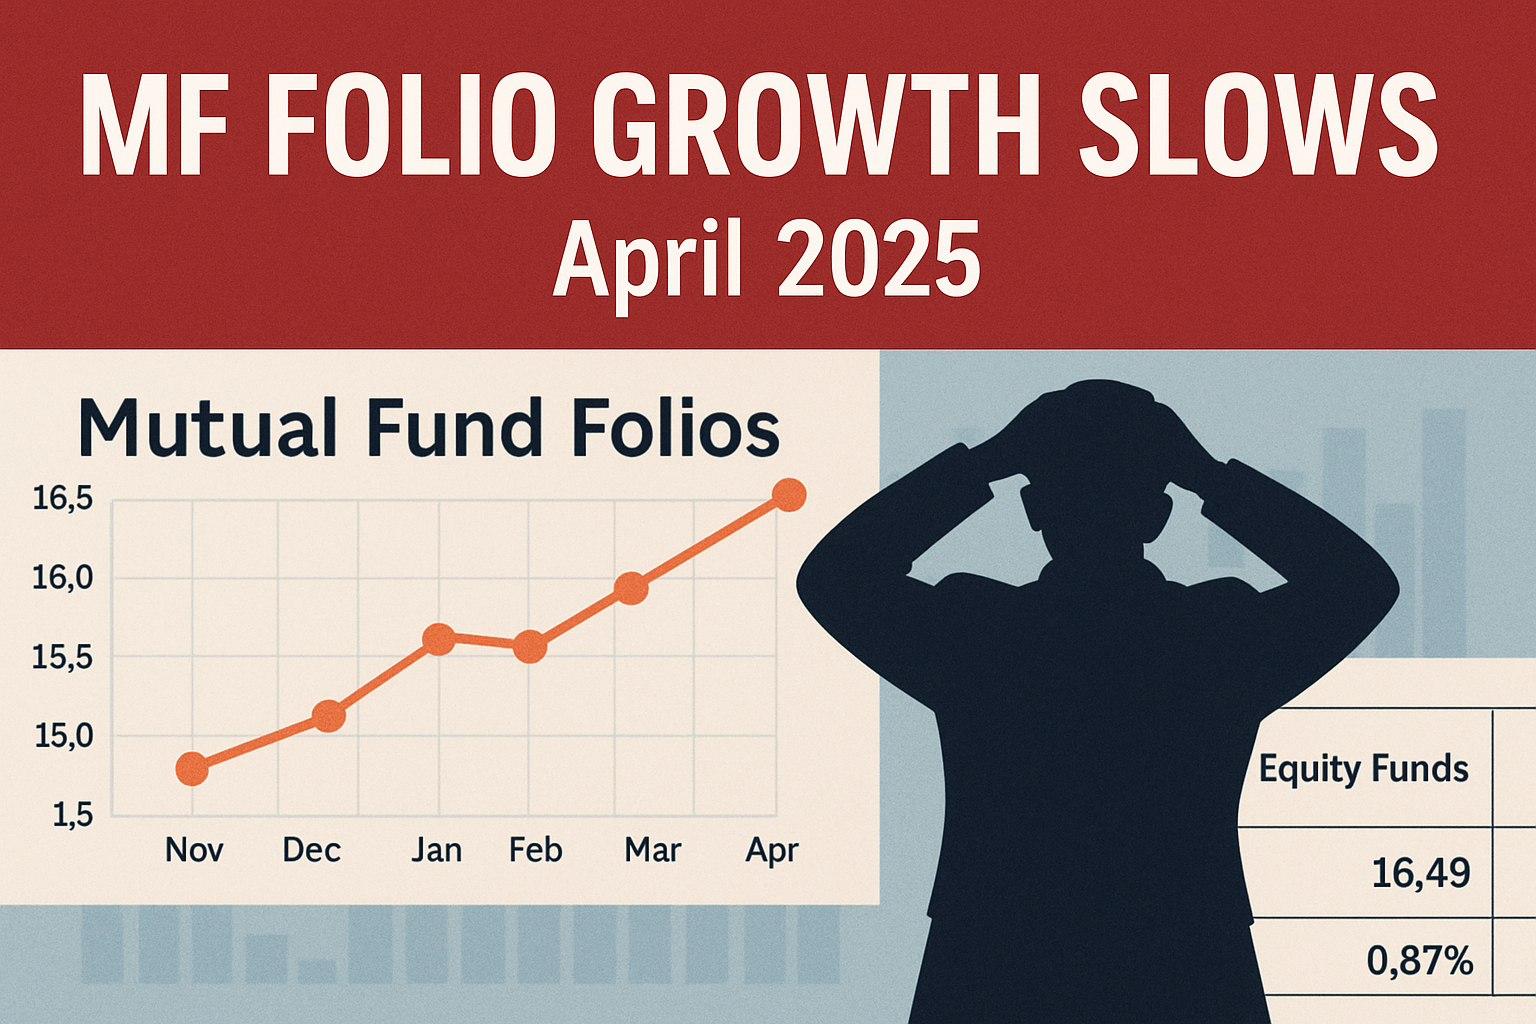
Despite record SIP stoppages, mutual fund folios continue to grow — driven by passive and equity funds. Here’s what AMFI data for the last 6 months reveals about India’s investor behavior.

Table of Content
What Exactly Do Mf Folios Tell Us?
Looking at the assets under management (AUM) of various categories can lull someone into believing that investor growth is happening. However, AUM is a combination of new folio additions, higher flows, and price appreciation. A much better metrics of genuine growth in investor interest would be the folios. The folios are account numbers that are unique to an AMC. However, while India has 23.63 crore mutual fund folios, the number of unique mutual fund investors as identified by their PAN is just about 5.5 crore, although the folio numbers still provide the best approximation of retail appetite.
| Folio Class | Apr-25 | Mar-25 | Feb-25 | Jan-25 | Dec-24 | Nov-24 |
| Equity Funds | 16,49,58,060 | 16,38,24,672 | 16,23,74,751 | 16,05,74,608 | 15,74,96,827 | 15,41,54,804 |
| % Change | 0.69% | 0.89% | 1.12% | 1.95% | 2.17% | 1.36% |
| Debt Funds | 70,36,533 | 69,49,759 | 68,91,665 | 68,49,320 | 68,24,169 | 68,56,900 |
| % Change | 1.25% | 0.84% | 0.62% | 0.37% | -0.48% | 0.52% |
| Hybrid Funds | 1,58,04,441 | 1,56,67,477 | 1,55,03,030 | 1,53,33,491 | 1,51,97,642 | 1,50,53,753 |
| % Change | 0.87% | 1.06% | 1.11% | 0.89% | 0.96% | 0.98% |
| Passive Funds | 4,18,97,969 | 4,14,72,421 | 4,09,23,090 | 3,98,62,263 | 3,89,19,288 | 3,82,05,720 |
| % Change | 1.03% | 1.34% | 2.66% | 2.42% | 1.87% | 1.86% |
| Data Source: AMFI (all MF Folios in actual numbers) | ||||||
How To Read The Above Table?
The above table captures the change in folios of the 4 categories viz. active equity funds, active debt funds, hybrid allocation funds, and passive funds over the last 6 months. In addition, the monthly growth has also been captured just below each category data. The last column in % change (in bold) refers to the compounded monthly growth. What is interesting is that out of 20 data points, MOM growth has been negative only once.
This data assumes importance in the light of the recent concerns over the SIP Stoppage Ratio. SIP Stoppage has been above 100% since January, and in April 2025 it spiked to a high of 298%. Despite this spike in SIP stoppage ratio, while the share of SIP Folios in total folios has gone down, it has been offset by a corresponding increase in non-SIP folios. The Compounded monthly growth shows best performance was by passive funds.
Mutual Funds Folio Accretion: What Is Behind The Numbers
Here are some key takeaways from a quick look at the monthly folio growth of various categories of mutual funds in India in last 6 months.
- Over the last 6 months, the best compounded monthly growth is evinced by passive fund folios at 1.86%, followed by active equity fund folios at 1.36%.
- While debt funds showed the lowest compounded monthly folio accretion, it is the only category, where monthly growth is progressively improving each month.
- While SIP folios have contracted by 1.18 crore folios since January, overall folios are still higher at 23.63 crore; hinting at surge in lumpsum folios.
- Has drop in folios led to drop in investors. We will only know that when we get unique PAN data, but for now it looks more like a shift and some folio consolidation.
Ideally, the best advantage of SIPs is when you persist in tough times. However, the data does reveal that investors are trying to shift from SIPs to market timing. The wisdom of such a move is questionable, but we have to wait and watch!
Comments