 Announcement: Lorem ipsum dolor sit amet, consectetur adipiscing elit. Donec et quam blandit odio sodales pharetra.
“How Mutual Funds Chose Their Favourite Sectors in FY25”
“In this article we unpack how mutual funds in India shifted their sectoral allocations in fiscal 2025 — looking at both absolute rupee AUM change and percentage growth — and highlight why Retail, Telecom and Pharma emerged as the top picks.”
Written by: SERNET Research Team
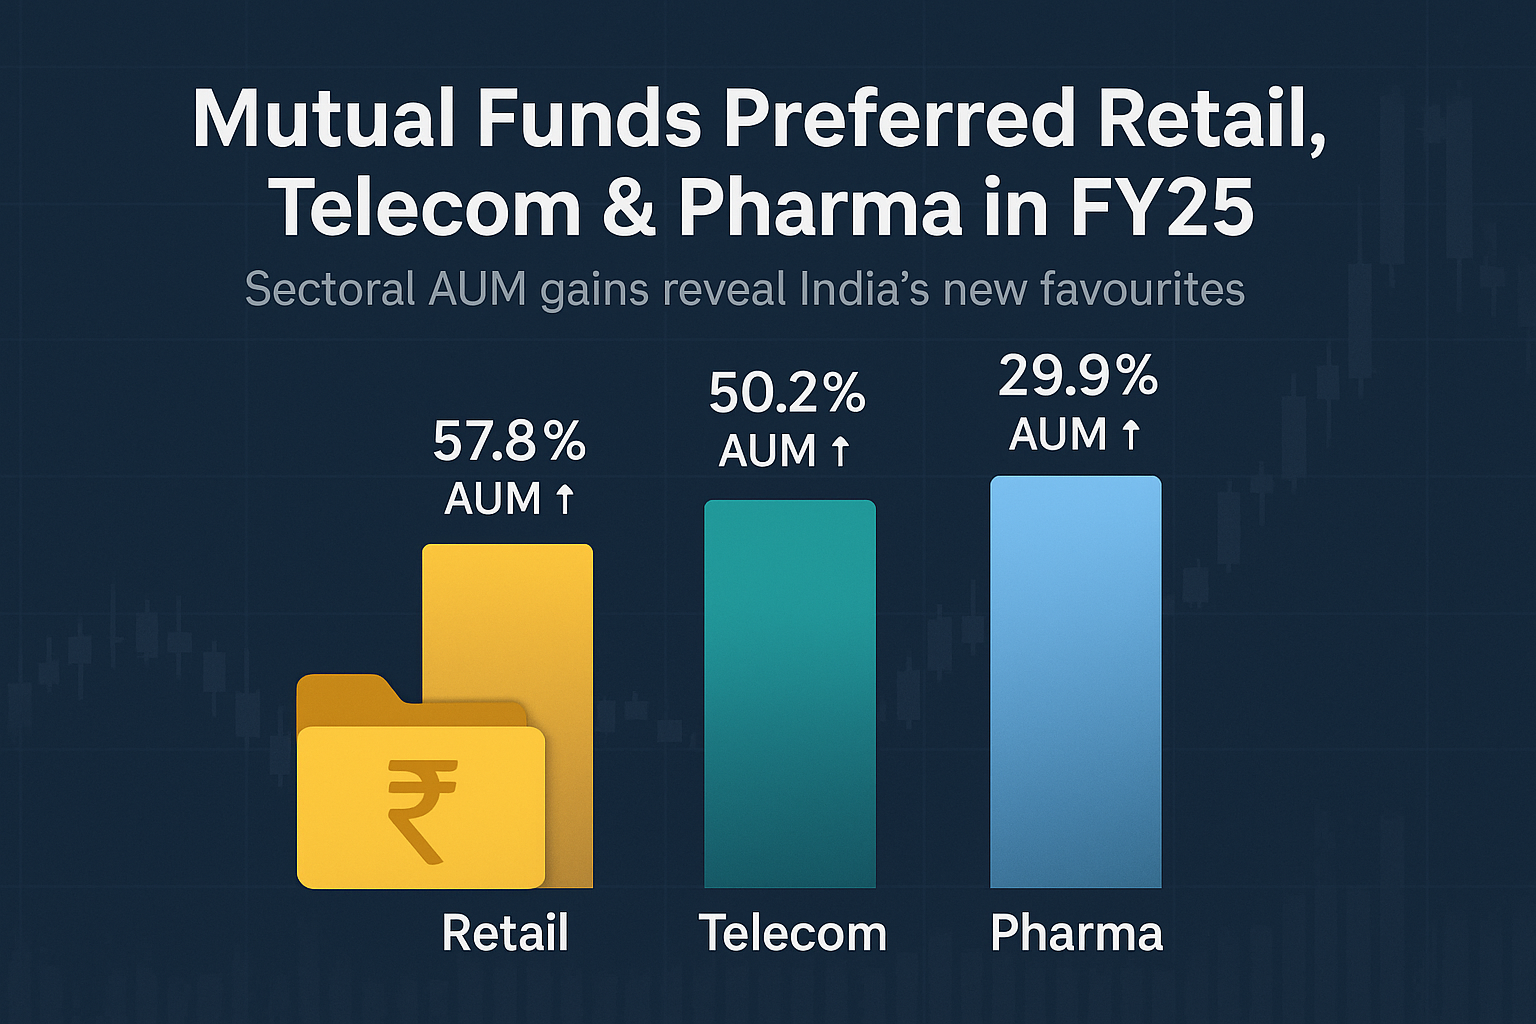
Table of Content
How We Arrived At The Most Preferred Mf Sectors?
How do we evaluate the preferred sectors of mutual funds over time. A one month shift may be too short and may capture pure momentum and give a wrong picture. A much better perspective would be an annual shift view. One can look at rupee change in AUM or percentage change in AUM. While the former captures actual wealth creation, the latter is less biased in favour of large and heavyweight sectors. We considered both these aspects, and arrived at the combined ranking. Table below is ranked on combined ranks!
| Sector
Classification |
March 2025
(AUM ₹ CR) |
AUM Change
(YOY ₹ CR) |
AUM Change
(YOY in %) |
Ranking
(₹ Shift) |
Ranking
(% Shift) |
Ranking
(Combined) |
| Retail | 1,27,671 | 46,738 | 57.75% | 5 | 2 | 7 |
| Telecom | 1,33,005 | 44,430 | 50.16% | 6 | 3 | 9 |
| Pharmaceuticals | 3,56,809 | 82,129 | 29.90% | 2 | 8 | 10 |
| Banking & Finance | 12,05,006 | 2,60,973 | 27.64% | 1 | 10 | 11 |
| Consumer Durables | 84,295 | 24,250 | 40.39% | 11 | 4 | 15 |
| IT-Services | 3,83,076 | 74,511 | 24.15% | 3 | 12 | 15 |
| Aviation | 27,827 | 10,861 | 64.02% | 15 | 1 | 16 |
| Chemicals & Fertilisers | 1,12,169 | 24,813 | 28.40% | 10 | 9 | 19 |
| Power | 1,27,615 | 25,459 | 24.92% | 8 | 11 | 19 |
| Alcohol | 27,574 | 7,632 | 38.27% | 16 | 5 | 21 |
| FMCG | 2,06,514 | 38,341 | 22.80% | 7 | 14 | 21 |
| Metals & Mining | 1,32,855 | 25,342 | 23.57% | 9 | 13 | 22 |
| Auto & Ancillaries | 3,59,875 | 52,341 | 17.02% | 4 | 19 | 23 |
| Agri | 16,447 | 4,532 | 38.04% | 20 | 6 | 26 |
| Diversified | 18,257 | 4,309 | 30.89% | 21 | 7 | 28 |
| Data Source: AMFI, MF Websites (Rankings in absolute) | ||||||
Equity Buying And Selling Is Much Beyond Equity Funds
Before we get into the mutual fund sectoral shift ranks, it must be remembered that we have defined equities in a much broader sense here. It is not just the holdings of active equity funds, but equity holdings of other categories too. For example, the AUM of active equity funds as of March 2025 stands at ₹29.45 Trillion, but the overall equity holding of Indian mutual funds stands at ₹41.11 Trillion. That means, equities worth ₹11.66 Trillion is held by hybrid funds and passive funds, and that is a substantial 28.4% of all equity holdings of mutual funds. This total equity holdings offer a clearer picture.
The 5 Most Preferred Sectors Of Mutual Funds In FY25
Here we look at the 5 most preferred sectors of Mutual Funds for FY25 (yoy basis), based on the combined rank of rupee AUM change and percentage AUM change.
- Interestingly, Retail had the best AUM accretion rank in FY25 and this can be attributed to the MF interest in digital ecommerce plays and new listings.
- Telecom is the second most preferred sector in terms of AUM accretion in FY25 and this can be largely attributed to the sustained MF interest in Bharti Airtel.
- Pharmaceuticals at third place saw substantial MF buying; both as a hedge in uncertain times and also because it was exempted from Trump tariffs.
- BFSI has seen a sharp revival after the correction and is the only sector very close to its highs. That was largely due to adjustment buying by mutual funds.
- Consumer durables is among the top picks. It is not vulnerable to cost push like FMCG and offers a good domestic India story in the midst of global trade weakness.
Comments