 Announcement: Lorem ipsum dolor sit amet, consectetur adipiscing elit. Donec et quam blandit odio sodales pharetra.
FPIs Turn Net Sellers in Nov 2025, But IPO Flows Cushion Outflows
The first half of November 2025 saw FPIs turn net sellers, driven by sharp secondary market outflows. Yet, mega IPO inflows from Orkla, Lenskart, Groww, Pine Labs and PhysicsWallah helped offset the damage. Here’s the full sector-wise breakdown and macro insights.
Written by: SERNET Research Team

Table of Content
FPIs Sell In First Half Of Nov-25; But IPOs Save The Day
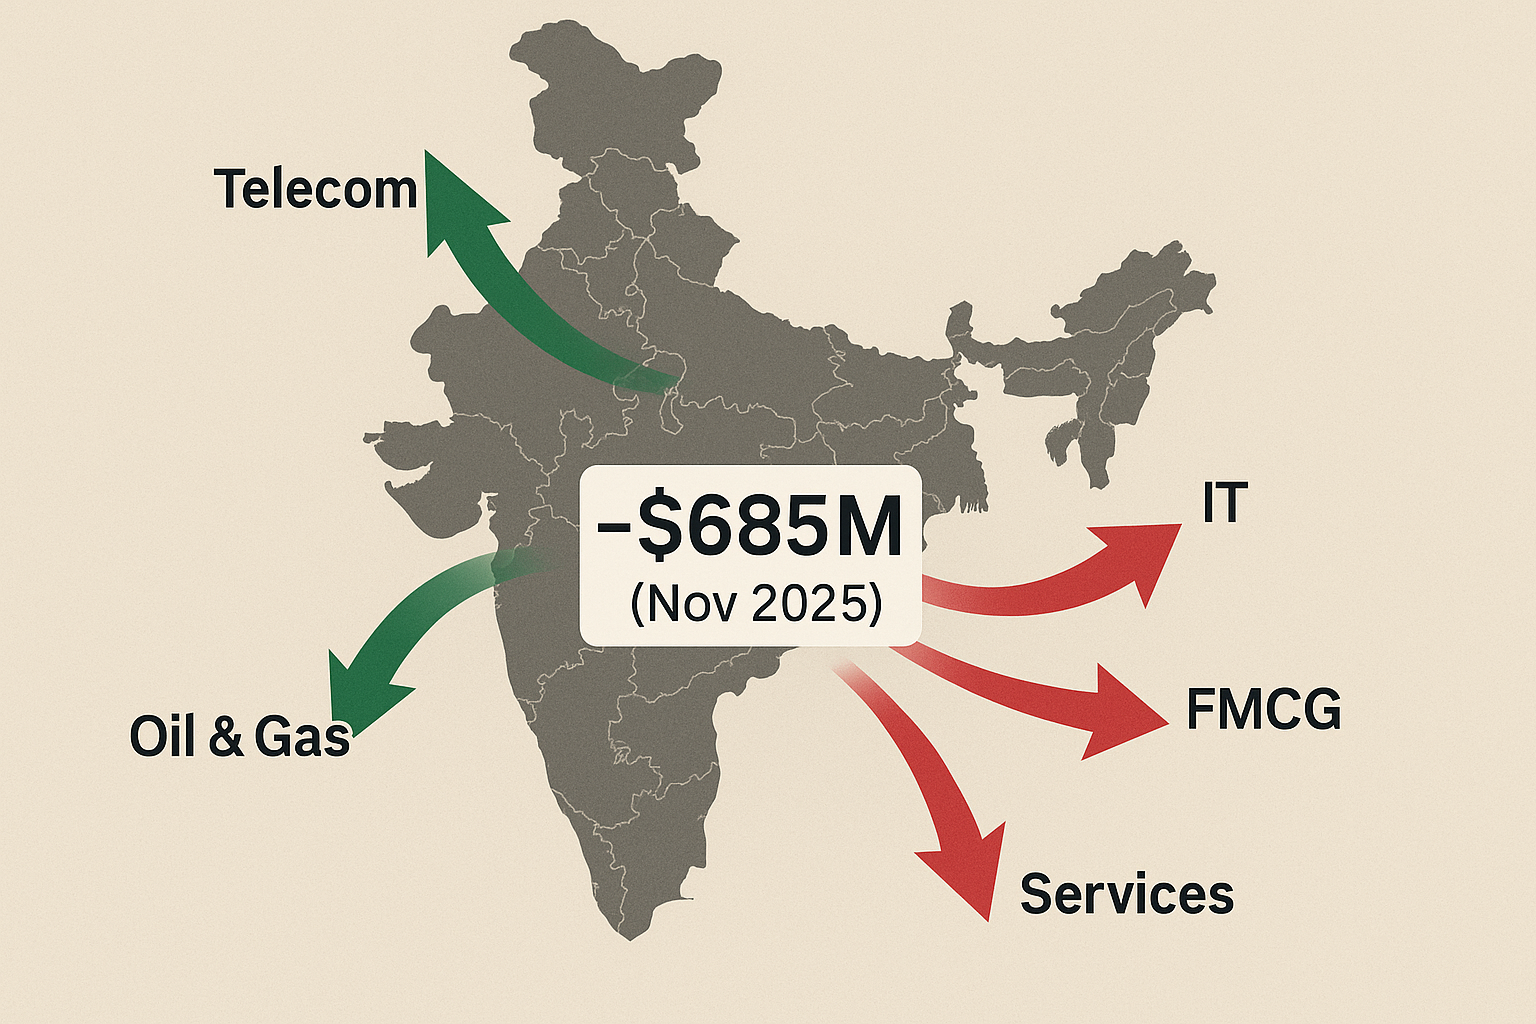
After strong inflows of $1.65 billion in October, the first fortnight of November 2025 saw FPI outflows of $(685) Million. Here is the catch! The actual data could have been much worse, had it not been for the strong positive impact of IPOs in the first fortnight of November 2025. For instance, the first fortnight saw net selling of $(1,570) million in the secondary markets, offset by net inflows of $885 million into IPOs. So, had it not been for the mega-IPOs in the first half of November 2025, the actual FPI selling figure could have been a lot worse. Thanks to some big FPI flows into IPOs like Orkla India, Lenskart, Groww, Pine Labs, and PhysicsWallah; the net FPI figure did not look too bad.
| Sectoral Classification
(NSDL Template) |
Equity Flows
($ Million) |
Sectoral Classification
(NSDL Template) |
Equity Flows
($ Million) |
| Telecommunication | 1,061 | Construction Materials | -42 |
| Oil, Gas & Consumable Fuels | 337 | Automobile and Auto Components | -43 |
| Other Sectors | 163 | Chemicals | -58 |
| Capital Goods | 89 | Services | -76 |
| Realty | 27 | Consumer Durables | -155 |
| Diversified | 5 | Fast Moving Consumer Goods (FMCG) | -230 |
| Utilities | 1 | Financial Services (BFSI) | -230 |
| Forest Materials | -1 | Power | -283 |
| Metals & Mining | -12 | Healthcare | -285 |
| Media, Entertainment | -17 | Consumer Services | -329 |
| Textiles | -21 | Information Technology (IT) | -549 |
| Construction | -37 | Grand Total | -685 |
| Data Source: NSDL | |||
Few Interesting Trends From Macro Data
Broadly, the equity AUC (assets under custody) of FPIs at $837.00 billion and the overall AUC at $918.83 billion are still well below the September 2024 peak levels, when overall AUC had crossed the $1 trillion mark. FPI holdings in Indian stocks is already at multi-year lows. What are the broad trends on FPI flows that we can decipher from the macro data? Firstly, the FPI flows in November first fortnight is largely driven by IPO flows, even as FPIs continue to sell and re-allocate from secondary markets. Secondly, debt inflows have seen a sharp improvement with a strong base case for rate cuts being built.
Sectoral Story Of FPI Flows In November 2025
Based on the FPI flow data published by NSDL for the first fortnight of November 2025, there are some broad inferences we can draw in terms of sectoral trends.
- Bulk of the FPI inflows in the first half have come into Telecom space at $1,061 million, as the stake sale by Singapore Telecom was absorbed by FPIs in India.
- Oil & Gas was another sector to see serious buying of $337 million in the first half; on the back of buying in RIL and interest in downstream oil due to improved margins.
- In the case of services and retail sector; the selling could have been a lot more intense, had it not been for FPI flows into IPOs of Lenskart, PhysicsWallah etc.
- Information Technology continued to see the maximum selling at $(549) million, as FPIs continued to lighten up on IT stocks after the mixed Q2FY26 results.
- Consumer services and FMCG took a hit as the full impact of the loss of input tax credit (ITC) on GST for these companies became evident in Q2FY26.
- The US exports story continues to cast a long shadow as sectors like IT, healthcare, and chemicals continue to be under pressure due to persistence of tariff uncertainty.
Despite better-than-expected Q2FY26 results (profit growth), FPIs are Long Asia – Short India. Probably, an Indo-US trade deal should shift sentiments and ensure that FPI funds flow back into India.
Comments