Announcement: Lorem ipsum dolor sit amet, consectetur adipiscing elit. Donec et quam blandit odio sodales pharetra.
Flows, Not Price, Drove Debt Fund AUM Surge in April 2025
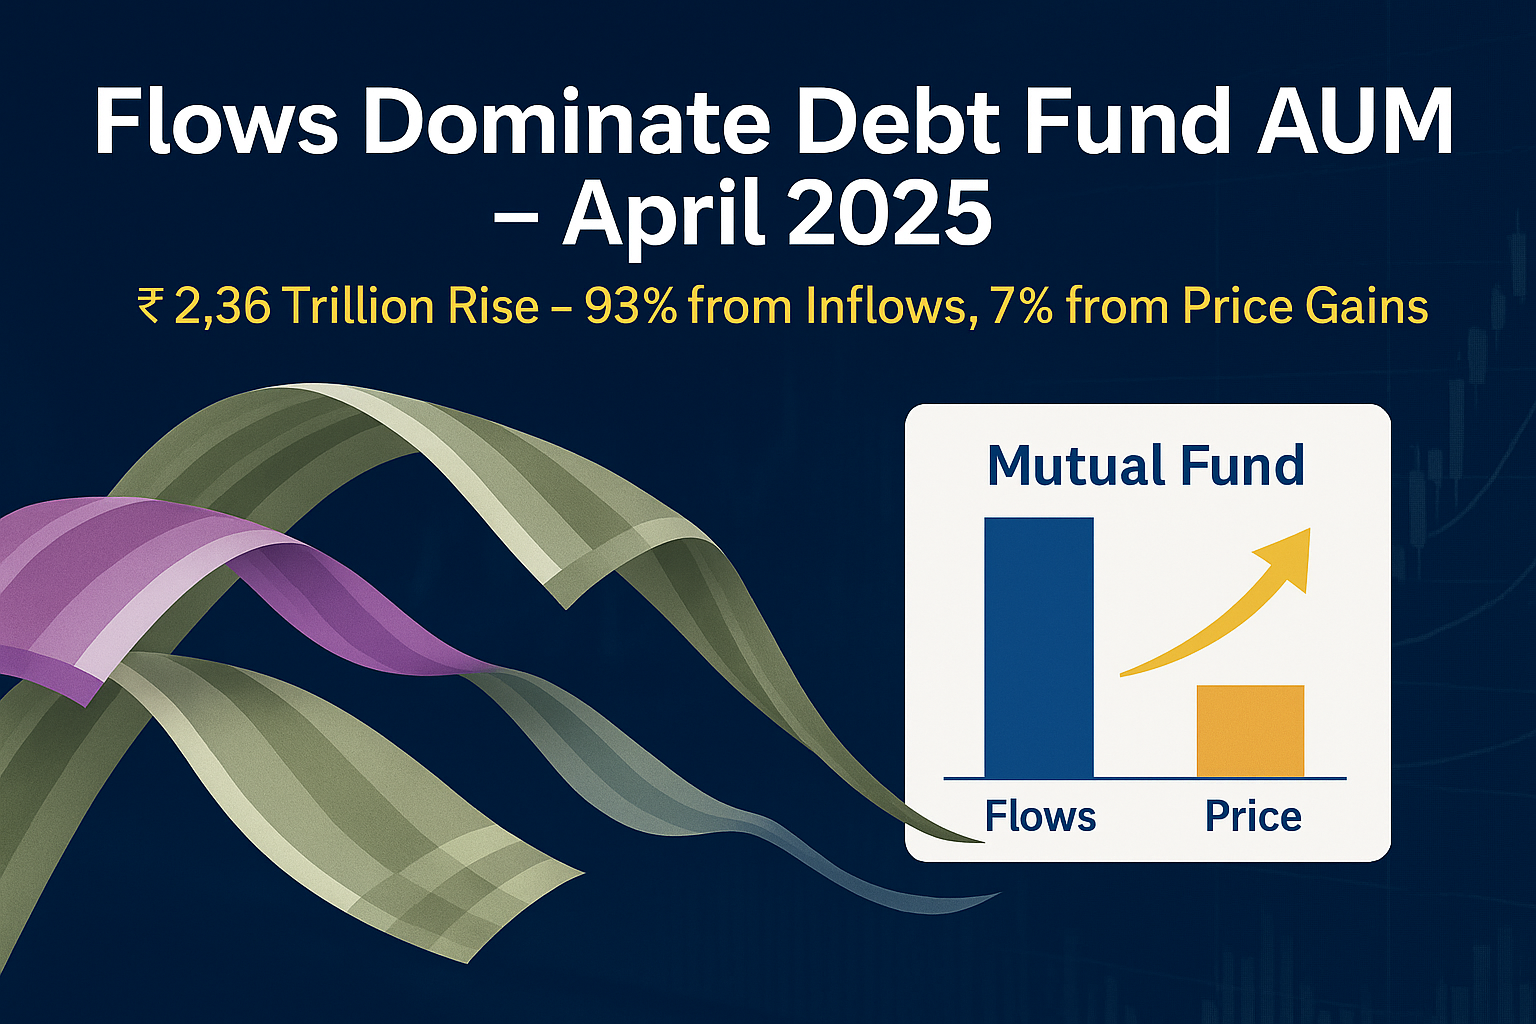
Debt fund AUM jumped ₹2.36 trillion in April 2025, with ₹2.19 trillion driven purely by investor flows. Price impact remained minimal at just 7.35%, highlighting how liquidity dominates in debt markets.

Table of Content
Debt Fund Aum Change – Flows Versus Price?
There is a subtle difference between how debt funds grow their AUM and how equity funds grow their AUM. In the case of equity funds (and even passive and hybrid funds to some extent) it is price change that often dominates. However, in case of debt funds it is flows that dominate. For instance, April 2025 saw debt funds AUM increase MOM by ₹2.36 trillion. Of that ₹2.19 trillion came from flows, and only ₹0.17 trillion from price.
| Active Debt Market Funds |
Net Inflow in the Fund | AUM Closing Value | AUM Accretion | Price Accretion | Price Move Dominance |
| Credit Risk Fund | -301.69 | 20,485.36 | 22.63 | 324.32 | 1433.26% |
| Gilt Fund | -425.05 | 41,428.66 | 438.73 | 863.78 | 196.88% |
| Gilt Fund with 10-Y duration | -38.74 | 5,006.89 | 68.45 | 107.18 | 156.59% |
| Dynamic Bond Fund | -10.23 | 36,231.29 | 639.64 | 649.86 | 101.60% |
| Long Duration Fund | 81.99 | 20,873.89 | 529.57 | 447.59 | 84.52% |
| Medium Duration Fund | 134.13 | 25,163.72 | 497.22 | 363.10 | 73.02% |
| Medium to Long Duration Fund | 100.04 | 11,859.04 | 305.36 | 205.32 | 67.24% |
| Banking and PSU Fund | 635.89 | 80,597.86 | 1,747.76 | 1,111.88 | 63.62% |
| Floater Fund | 570.41 | 50,979.75 | 1,157.71 | 587.30 | 50.73% |
| Corporate Bond Fund | 3,458.42 | 1,81,953.76 | 6,153.58 | 2,695.17 | 43.80% |
| Short Duration Fund | 4,763.21 | 1,19,708.54 | 6,387.69 | 1,624.47 | 25.43% |
| Low Duration Fund | 9,370.62 | 1,23,442.34 | 10,514.01 | 1,143.38 | 10.87% |
| Money Market Fund | 31,507.04 | 2,66,389.93 | 33,727.09 | 2,220.04 | 6.58% |
| Ultra Short Duration Fund | 26,733.81 | 1,26,436.70 | 27,894.91 | 1,161.10 | 4.16% |
| Liquid Fund | 1,18,656.44 | 5,59,824.18 | 1,22,050.25 | 3,393.81 | 2.78% |
| Overnight Fund | 23,899.98 | 86,833.82 | 24,375.39 | 475.41 | 1.95% |
| Active Debt Funds | 2,19,136.27 | 17,57,215.73 | 2,36,509.97 | 17,373.71 | 7.35% |
| Data Source: AMFI (all figures are ₹ in Crore) | |||||
What Are The 3 Classifications in the Table About?
- The first set of debt funds, shaded in green, are the funds with a longer average duration. These fund gain more from a fall in interest rates and bond yields.
- The second set of funds, shaded in yellow, are the funds that have a medium duration or are specialized funds. They largely play on rating and duration shifts.
- The third set of debt funds, shaded in blue, are the shorter duration debt funds, or treasury funds. They see yields rise when there is liquidity shortfall in the market.
What We Read From The Debt Fund Aum Accretion?
Let us start with the top segment (shaded in green), which shows the longer duration funds. How did these fund land up on the top. Obviously, funds like credit risk funds, long duration funds, and gilt funds are the ones that gain the most from a fall in rates. That has been the trend in the last 3 months. To accentuate the price performance, 4 out of the 5 longer duration funds have seen negative flows, so the role of price in determining their AUM accretion becomes a lot more prominent.
The ones in the middle (shaded in yellow), are funds that are specialized or of medium duration. They tend to see shifts between price and flows when there is a shift in rates or liquidity. In the case of these funds, the role of price in AUM accretion is more prominent than the shorter term funds, but much lower than longer duration funds.
Finally, we come to the shorter duration funds (shaded in blue). Interestingly, these funds go through flow cycles every 3 months as corporates churn these funds to manage their advance tax liability. In their case, it is typically flows that dominate and prices have a very small role to play. Due to the strong influence of these treasury funds, the overall role of price dominance of all debt funds is restricted to just 7.35%.
Comments