 Announcement: Lorem ipsum dolor sit amet, consectetur adipiscing elit. Donec et quam blandit odio sodales pharetra.
SIP Flows in August Cool Off, But Stoppage Ratio Surges — What It Means for Investors
After hitting record highs earlier this year, India’s monthly SIP inflows eased to ₹28,265 crore in August 2025. At the same time, SIP stoppages rose sharply, even as SEBI’s folio cleanup continued to reshape investor participation. Here’s a closer look at how SIP trends are evolving — and what they reveal about investor sentiment.
Written by: SERNET Research Team
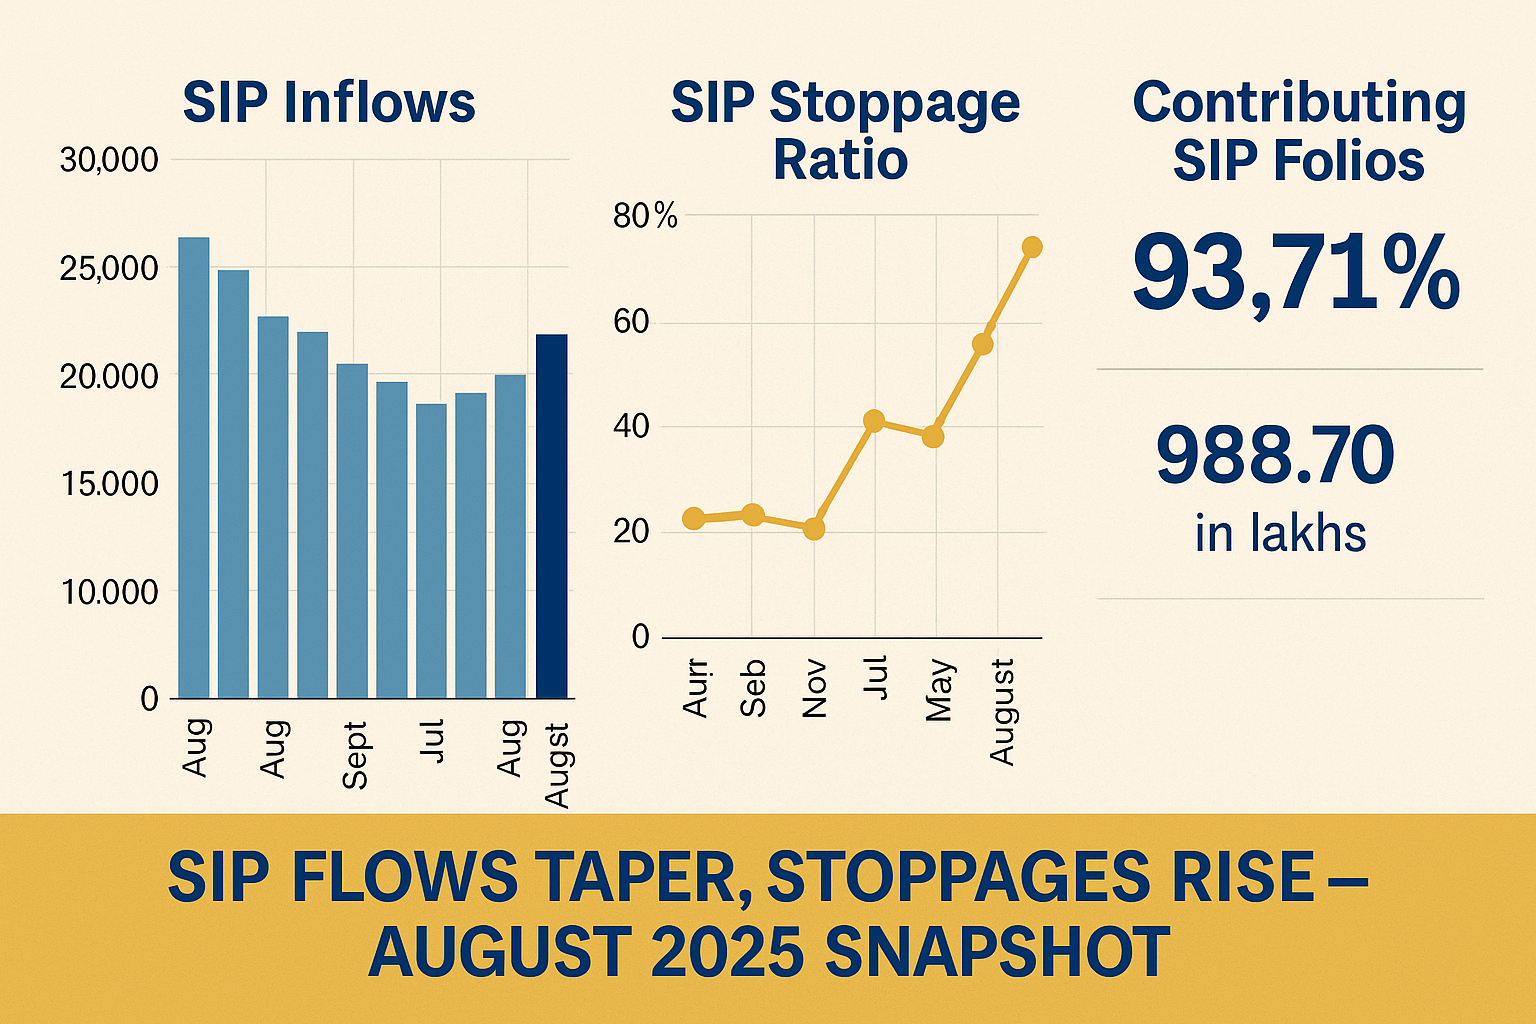
Table of Content
How Monthly Sip Flows Evolved Over Last 1 Year
Along with the monthly data on category-wise flows into mutual funds, AMFI also puts out data on the monthly SIP inflows. However, these SIPs are reported on a gross basis, and not on a net basis. Here are the gross SIP flows for the last 13 months.
| Monthly
MF Data |
Monthly SIP Inflows
(₹ Crore) |
SIP AUM
(₹ Crore) |
SIP Flow / SIP AUM
(% Ratio) |
| Aug-24 | 23,547 | 13,38,945 | 1.76% |
| Sep-24 | 24,509 | 13,81,704 | 1.77% |
| Oct-24 | 25,323 | 13,30,430 | 1.90% |
| Nov-24 | 25,320 | 13,54,105 | 1.87% |
| Dec-24 | 26,459 | 13,63,137 | 1.94% |
| Jan-25 | 26,400 | 13,19,853 | 2.00% |
| Feb-25 | 25,999 | 12,37,784 | 2.10% |
| Mar-25 | 25,926 | 13,35,188 | 1.94% |
| Apr-25 | 26,632 | 13,89,655 | 1.92% |
| May-25 | 26,688 | 14,61,360 | 1.83% |
| Jun-25 | 27,269 | 15,30,574 | 1.78% |
| Jul-25 | 28,464 | 15,19,456 | 1.87% |
| Aug-25 | 28,265 | 15,18,368 | 1.86% |
Data Source: AMFI
Gross SIP flows into SIPs have been improving sharply each year since FY21. For FY25, the total annual SIP flows stood at ₹2,89,352 Crore, which was 45.2% higher than FY24. If you take the first 5 months of FY26 and annualize it; the figure is ₹3,29,563 Crore, which is 13.9% higher compared to FY25. However, monthly SIP flows crossed 2% of SIP AUM only twice (January and February 2025) in the last 1 year.
How Sip Folio Clean-up Helped The Industry
Between January 2025 and April 2025, we saw a persistent spike in SIP stoppages with 1.43 crore dormant SIP folios being disbanded. As per the revised SEBI guidelines on dormant folios, elimination of dormant SIP folios was only done with prospective effect. Between January and April 2025, the SEBI took up the elimination of all legacy dormant SIPs by coordinating closely with mutual fund registrars and stock exchanges. As a result, 1.43 crore dormant SIP folios were eliminated, leaving a much cleaner and meaner SIP folio picture.
The reason this move is material is that the large proportion of dormant SIPs were distorting the SIP investment picture in India. The base of SIP folios was bloated; and hence the active folios ratio was looking artificially low. This one-time exercise led to the cleaning up of the folios; and SIP flows have now returned back to their peak period flows. The gross SIP flows do not capture the stoppages. For that, you need to refer to the net SIP flows, which also factors in the SIP stoppage ratio.
Sip Stoppage Ratio – Moderates But Higher Than Past Averages
Let us first look at how the outstanding SIP folios and the outstanding SIP AUM moved between July 2025 and August 2025. Total SIP folios grew from 944.97 Lakh folios in July 2025 to 959.04 Lakh folios in August 2025. That is an MOM folio accretion of 1.49%. August 2025 saw a visible slowing of SIP folio additions. This can be attributed to tariff uncertainty and the elevated levels of the market. Both are factors that make the SIP investors cautious.
Let us also talk about how SIP AUM moved between July 2025 and August 2025. For the month of August 2025, SIP AUM at ₹15,18,368 Crore; was marginally lower than SIP AUM of ₹15,19,456 Crore as of July. This lower AUM is more due to the stock market correction and depletion in NAVs. Now for SIP Stoppage Ratio (Discontinued SIPs to New SIPs).
| Apr-24 | May-24 | Jun-24 | Jul-24 | Aug-24 | Sep-24 | Oct-24 | Nov-24 | Dec-24 | Jan-25 |
| 52.24% | 88.38% | 58.68% | 51.40% | 57.14% | 60.72% | 60.91% | 79.12% | 82.75% | 109.15% |
| Feb-25 | Mar-25 | FY25 | Apr-25 | May-25 | Jun-25 | Jul-25 | Aug-25 | FY26 | |
| 122.76% | 128.27% | 75.63% | 352.79% | 72.12% | 77.77% | 62.66% | 74.51% | 115.92% |
Data Source: AMFI
Back during the COVID peaks, the SIP stoppage ratio had crossed 60%, which was unheard of back then. The norm was a SIP stoppage ratio of 40-50%. One can argue that the SIP stoppage ratio of 75.63% for FY25 and 115.92% for FY26 were distorted due to the SIP clean-up. However, even if you exclude these months for FY25, average SIP stoppage ratio was 65.7%. Clearly, the SIP stoppage absolute levels have gone up.
Good News – Productive Sip Ratio Has Improved
One big advantage of the SIP folios clean-up was the boost to Contributing SIP folio ratio. The Contributing SIP ratio was in the range of 77-80% till November 2024 and was above 80% till March 2025. However, post clean-up, Contributing SIP Folio ratio has held above 90%. That is a clear outcome of the elimination of defunct folios, which has improved the ratio of contributing SIPs to the overall SIP.
| Transaction
Month |
Outstanding
SIP Folios |
Contributing
SIP Folios |
Contributing SIP
Folio Ratio |
| Aug-25 | 959.04 | 898.70 | 93.71% |
| Jul-25 | 944.97 | 911.18 | 96.42% |
| Jun-25 | 919.32 | 864.70 | 94.06% |
| May-25 | 905.57 | 856.00 | 94.53% |
| Apr-25 | 889.08 | 838.25 | 94.28% |
| Mar-25 | 1,005.39 | 811.16 | 80.68% |
| Feb-25 | 1,016.75 | 826.41 | 81.28% |
| Jan-25 | 1,026.89 | 834.97 | 81.31% |
| Dec-24 | 1,032.03 | 827.44 | 80.18% |
| Nov-24 | 1,022.67 | 797.32 | 77.96% |
| Oct-24 | 1,012.34 | 794.48 | 78.48% |
| Sep-24 | 987.44 | 774.61 | 78.45% |
| Aug-24 | 961.36 | 745.10 | 77.50% |
Data Source: AMFI
Compared to the last few months, the Contributing SIP Folio ratio has fallen. There could be 3 reasons for the same. Firstly, the incremental gains of the dormant folio elimination are now done. Secondly, the market uncertainty may have discouraged number of investors from renewing / continuing their SIPs. Above all, the more pragmatic reason was the
holidays in the last few days of August. That led to SIP renewals being postponed to September; when we will get a clearer picture.
Comments